User Guide
UnityOne
UnityOne helps you manage your hybrid, multicloud environments from a single pane of glass.
- Current Version: 3.60
- Last Updated: 12 July, 2024
If you have any questions that are beyond the scope of this guide, please feel free to email via our Contact Page..
Introduction
UnityOne is a comprehensive cloud management platform (CMP) that assists you with the management of data centers, public cloud (AWS, GCP, Azure, OCI), and private cloud (Hyper-V, VMware, OpenStack) from a unified dashboard. Additionally, UnityOne allows you to observe, monitor, and manage your hardware and virtual assets of data centers and the cloud ecosystems.
A standalone tool that offers management of various aspects of IT ecosystems like cost management, container management, device management, Kubernetes management, sustainability management, mesh management, user group management, ITSM, DevOps automation, alerts, etc.
Feature Highlights
UnityOne has flexible options where you can use it as a SaaS tool or an on-premise tool per your organizational needs.
| Features | Details |
|---|---|
| Device Discovery and Onboarding | Auto-discovery of the infrastructure and onboarding of devices, with details including hostname, IP, hardware manufacturer, hardware model, operating system, etc. |
| Data Center management | DCIM solutions from UnityOne let organizations visualize, monitor, and manage physical assets and cabinets of their distributed data centers from multiple locations globally through a unified system. |
| Private Cloud management | Robust dashboards to securely access and control your physical or virtual assets within private cloud infrastructures, such as hypervisors (Hyper-V, OpenStack, VMware), PDUs, Switches, Firewalls, Load Balancers, Mac mini devices, etc. Real-time monitoring statistics will ensure that your hybrid cloud resources are being utilized to their full potential. |
| Public cloud management | Manage your public cloud infrastructures remotely across various service providers like AWS, GCP, Azure, and OCI. You can easily discover, onboard, manage, monitor, and observe the various public cloud resources offered by multiple cloud vendors. |
| Container management | Manage multiple container orchestrations like docker, docker swarm, Kubernetes, etc. With superior resource allocation and optimization, you can efficiently automate the build, deployment, and scaling of your containerized orchestrations. |
| Mesh management | A mesh management service that supports several vendors, such as AWS mesh manager, Anthos, and Istio, allows you to view, monitor, configure, and administrate clusters, pods, and secure infrastructure deployed on various mesh managers from a single interface. |
| Cost management | Analyze your monthly spending on data centers, public clouds (AWS, Azure, GCP, OCI), and private clouds as well as monitor and calculate your multicloud and hybrid cloud billing from a unified platform. |
| Audit and Compliance | Audit the activities on any device across your data centers, private clouds, and public clouds to comply with regulatory and audit requirements. Identify the ‘What, Who, and When’ for any actions on your global infrastructure. |
| DevOps automation | You can use UnityOne's built-in DevOps automation features or connect external DevOps automation tools like Jenkins, Puppet, Ansible, and Chef to automate configurations, deployments, and releases all in one go. |
| Carbon Footprint Analysis | The recommendation engine of UnityOne's sustainability feature will assist your organization towards carbon neutrality by tracking, analyzing, and monitoring the carbon emissions of global IT assets. You can view your entire IT asset’s carbon emission levels and generate customized reports to comply with global ESG norms and standards. |
| IT service management | A centralized dashboard allows you to view and manage your organization's service requests and support activities. You can integrate your own IT service management tools or use the platform's built-in ITSM solutions, such as Zendesk, ServiceNow and others. |
Getting Started
To access and use UnityOne's SaaS version, you must log in using an existing login ID and password. To sign in using your UnityOne account, follow the instructions below
- Please contact our sales team at
sales@unityone.aiif you're a new user. - Click on the URL https://unity.unitedlayer.com
- Enter your login ID and password, then click the login button.
- You can view the UnityOne dashboard now
Note If you still haven’t received your access, please contact your system administrator or contact support@unityone.ai.
In case you forget your password, navigate to the "FORGOT PASSWORD?" option, enter your registered email address, and click "SUBMIT." A link to create a fresh password will be emailed to you.
Pre-requisites
The procedures mentioned below are required to enroll the environment to UnityOne for the first time.
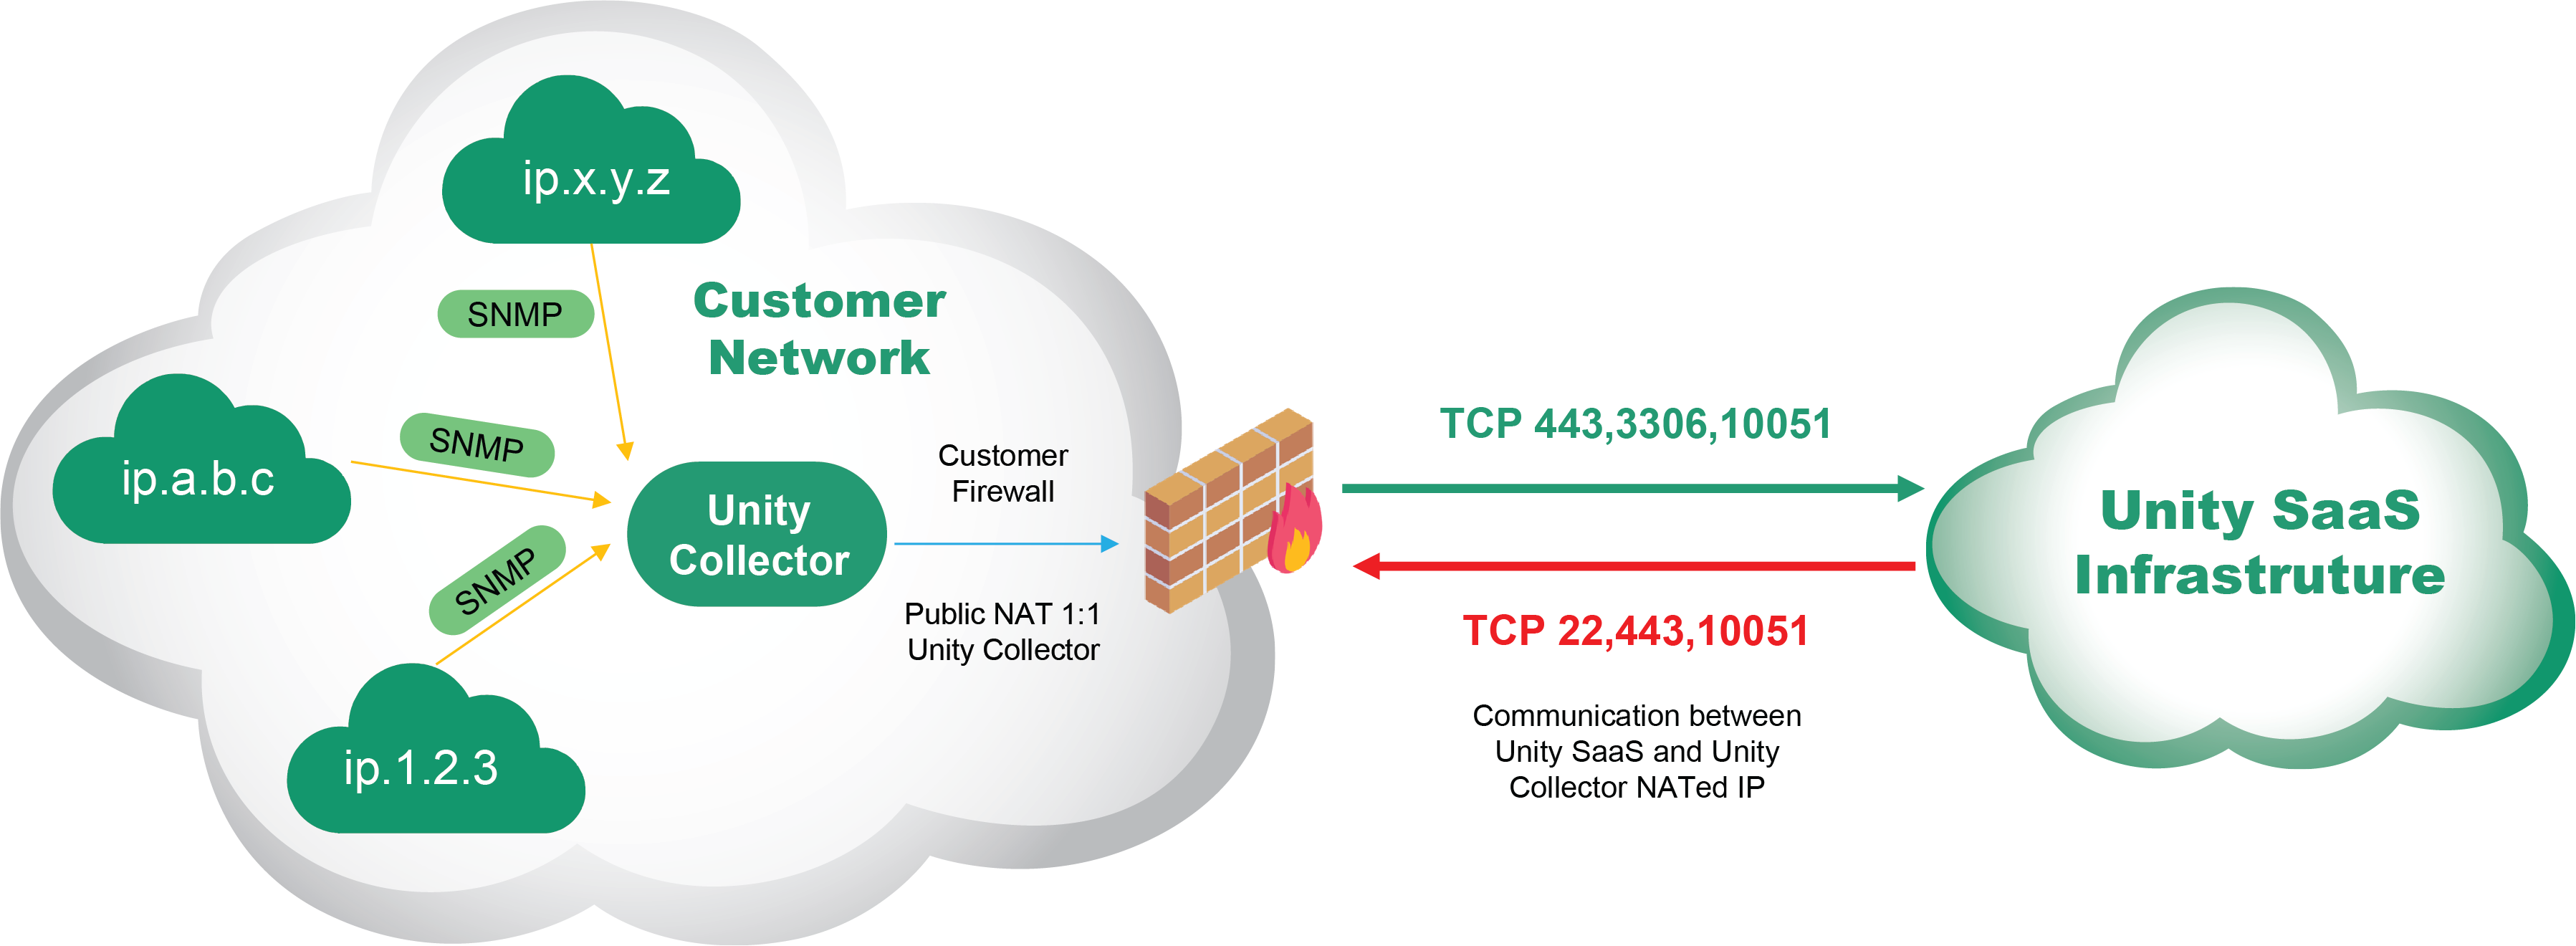
You need to set up connectivity between Unity and your infrastructure; for this, a 1:1 NAT connection should be established at Unity collector, which is a lightweight VM that needs to be provisioned and configured at your end through which it communicates with your infrastructure and collects the device details, respectively.
The following are the obligatory configuration steps to enroll your organization’s infrastructure into the UnityOne Platform.
- UnityOne Collector VM Setup
- The Unity Support team will share a collector image with you, and you can use the same to provision your infrastructure. The VM’s configuration is as follows:
OS- DebianRAM- 4GB-8GBvCPU- 4 – 8Hard Disk- 120GB
Note VM resource requirements may vary based on the volume of infrastructure onboarded into UnityOne..
- The Unity Support team will share a collector image with you, and you can use the same to provision your infrastructure. The VM’s configuration is as follows:
- How to connect the collector to UnityOne
Note The UnityOne network team will assist you in completing this step..
- The following ports are to be enabled at your end:
- Inbound/Outbound traffic to be enabled for
80, 443 & 22
- Inbound/Outbound traffic to be enabled for
Once you establish the connectivity, follow the directions given below to setup a collector with UnityOne.
- The following ports are to be enabled at your end:
- Steps to add a collector to UnityOne:
- Login into the portal with your credentials
- Navigate to the left pane menu: UnitySetup > Onboarding
- In here, choose the “Add Collector” option from the user dashboard.
- Enter details such as name, IP, SSH port, SSH username, SSH password, and SNMP community. (Optional)
- Confirm your details by clicking on “Submit” (this will push the required configuration to the Collector).
Note Please make sure to give root access for SSH
Let's first explore the available roles and how to add a role to a user before moving on to the onboarding process. To initiate the onboarding process, at least one admin user is required.
The steps to assign a role to the user are outlined below.
Setup User Groups
There are two different types of user roles in UnityOne:
Admin- Who can view, edit, add, or delete the assets and resources.User- Who can only view the assets and resources (cannot perform add or deletion of resources).
Navigation
Navigate to the main menu > UnityOne Setup > User groups
- How to add a new user
- The following ports are to be enabled at your end:
- Click on the ‘Add User’ button
- Fill the required details such as email, first name, last name
- Authorized user should have admin access (Yes/No)
- Click on “Submit” to successfully add an user
- Confirm your details by clicking on “Submit” (this will push the required configuration to the Collector).
Once the user is added, you will receive a welcome email from UnityOne with the password reset link. The Login name will be the Email ID of the added user.
NotePlease check the Spam folder if you haven't received the welcome email with the password reset link.
The new user is now listed on the user group detail page, UnityOne will provide summary information such as Email ID, First name, Last name, Active Status, and other action buttons.
- The following ports are to be enabled at your end:
- Action button functionalities
Edit– This option can be used to edit a user detailDeactivate– This button can activate or deactivate the access of a userReset password– You can reset your password from here through a reset password email link.Delete– This action will assist you to delete an user account permanently from UnityOne platform.
Note An administrator email ID will have a tick mark. This feature can distinguish an admin account from a regular user account.
Infrastructure Onboarding
After completing the prerequisite steps, proceed to the next step: Onboard your resources into UnityOne.
The onboarding process is divided into four stages:
- Connect to Unity
- Onboard Assets
- Activate Monitoring
- Activate Management
If you’ve followed this guide to this point, you would have successfully added a collector. This will allow us to provide multiple options for onboarding. There are three ways of onboarding your infrastructure:
- Discover and Onboard
- Import Inventory
- Onboard via Device CRUD
The onboarding methods are described briefly in the subsequent sections.
Discovery & Onboard
Once the collector is registered, navigate to the Main menu > UnitySetup > Onboarding
NoteIf your collector is not registered, please refer to the section “How to connect a collector to UnityOne” for more details.
The added collector will scan the subnet as a part of discovery and automatically discover all the devices within the network. This module simplifies the tedious task of manually adding assets to the platform.
You can view a feature tracker with clickable icons on the top of the page providing different details like connectivity, credentials, network scan, data center, cabinet, PDU, firewall, switch, load balancer, server, hypervisor, Mac Device, storage, and summary.
NoteYou will be able to see these details after you add a collector.
This tab displays information about an existing collector, such as its name, IP address, SSH user, SSH port, deployment status, created date, and test result.
Action Buttons:
Test Connection– This action button tests the connection by performing ping tests or assessor tests. (Red indicated failure and green indicates a successful test of connection.Edit– This action button will assist you to edit collector detailsManage by creating a support ticket– This button will assist you in opening a ticket in the integrated ITSM system for review by the support team.Delete– This action button can be used to delete a collector.
The following procedures are part of the discovery phase; if you prefer to discover your infrastructure automatically before onboarding, please continue to the next step. If you already have inventory details available. Please see the section "How to Onboard Assets Via Import Inventory."
The discovery will be based on SNMP, SSH, and WMI. For this, UnityOne needs some credentials from your infrastructure. In this section, you can enter the required credentials, which will be encrypted and saved in our database.
To add your credentials to the platform, here, you can click on the button “add credential,” fill in the details name, description and select the type of credential you want to add ( SNMPv1, SNMPv2, SNMPv3, SSH, SSH key, windows, active directory). You can also view the already added credential information such as name, description, type, created by, edited by, and edited date, and action buttons for editing and deleting credentials.
When the collector connectivity test is green, the discovery of the infrastructure can be done from “Network Scan. Click “Add discovery” and enter information mentioned below:.
Name– In this option, you can enter any name of your choice.Type– You can select the type of discovery, that is, via subnet or active directory.Subnet– Enter your subnet address here, if you have selected the type as “Subnet”.Credentials– From this section, you can select the previously stored relevant credentials.Collector– You can select the registered collector from here.
NoteYou will have two options to run your network scan. The first is “Run Now,” and the other is “Schedule a scan.” If you have selected “Scheduled Scan,” you can opt for Once, Daily, Weekly, or Monthly scans as per your preference.
After you have selected your preferred choices, click on “Submit” to run a network scan.
You may also see the specifics of your previously discovery jobs, such as their name, target type, target, collector, last run, duration, schedule, created by, and any other updates.
Action Buttons
Execute– This action button can be used to execute the auto-discovery.Schedule history– This action button will assist you in viewing the scheduled history of discovery.Network Topology– You can view the neighboring devices with this option.Edit– You can edit discovery details with this button.Delete– Deletion of the added subnet can be done by this option.
In this section, you can view the scan results discovered after the discovery jobs. You can select “Discovery Task” and then click on next.
You can use the action button to delete them.
The device type will be automatically identified by the scan and mapped. You can change the device type if you see any inconsistencies by choosing the appropriate option from the drop-down.
NoteAny missing data from your devices can be added to the UnityOne platform from the respective sections using the CRUD options. If any mandatory details are missing for any device, there will be an error for the respective entry, which will be excluded from onboarding, and for the same, you can resubmit your devices to complete onboarding. This same principle applies to all device types.
Data Center
You can view the list of existing data centers from this widget. You can also use the CRUD (Create, Read, Update, Delete) option to modify or delete the existing data center information from the available action buttons.
Cabinet
Click 'Next' to view the scanned results of your cabinet, inside the existing data centers.
You can view information like its name, data center, model, available units, and capacity. You may add a new cabinet by clicking the 'Add Button' and then edit or delete it using the relevant action buttons.
PDU
The scanned results of your PDUs, such as hostname, management IP, model, cabinet, position, and size, can be viewed by clicking on the 'PDU' icon.
Firewall
Click the 'Firewall' button to see your firewall's scanned results, including hostname, management IP, model, manufacturer, operating system, cabinet, position, and size.
Switch
Click the 'Switch' button to see the scanned results for your Switch, which includes hostname, management IP, manufacturer, model, OS cabinet, position, and size.
Load balancer
By clicking the 'Load Balancer' button, you can check the scanned results for your load balancer, including hostname, management IP, manufacturer, model, operating system, cabinet, position, and size.
Server
Click the ‘Server’ icon to view the results of your server's scan, including hostname, management IP, manufacturer, OS, model, cabinet, position, and size.
Hypervisor
Navigate to the ‘Hypervisor’ button to find your hypervisor's scanned results, such as hostname, management IP, manufacturer, OS, model, cabinet, position, and size.
Mac mini
Clicking the ‘Mac mini’ button will display the scanned results of your Mac mini devices, like hostname, management IP, manufacturer, OS, model, and cabinet.
Storage
The results of your storage device's scan will be displayed when you click the 'Storage' button. Details such as hostname, management IP, manufacturer, operating system, model, cabinet, position, and size will be visible here.
Summary
Here, in a comprehensive grid view, you may see a list of your onboarded assets, including load balancers, firewalls, switches, etc. Alternatively, you can fill your asset details in an excel sheet and upload it into UnityOne.
How to onboard assets via import inventory
If you have the inventory details, this is the best way to onboard; you may use the available data to import and onboard into UNITY.
From the menu, navigate to UnityOne Setup > Onboarding > Excel onboard.
You need to use UnityOne’s template for this process and the data will be updated in the same template. An onboarding status map at the top can help you understand how your onboarding phases are progressing.
- Click on the ‘Download Template’ button to download the template excel file.
- Fill in the sheet with asset details accordingly
- Upload the file by browsing or dragging the file.
- Once the data is uploaded, you can select the respective import task and click on next.
- Based on the inputs uploaded in the excel sheet, the tool will take the details around cabinets, data centers, PDU, firewalls, switches, load balancers, servers, hypervisors, mac devices, and storage.
- Verify the details under each device mentioned, and click next. You will get directed to the next grids.
- Once you have finished the entire status quo, which is visible at the top, you may check the complete list of devices uploaded on the final page.
Add Devices Manually
UnityOne platform allows you to onboard your devices manually by performing CRUD operations.
Click on UnityOne > Select Devices.
Here you will see tabs like device name, switches, firewalls, load balancers, etc.
On each tab, you will find an ‘Add’ button for the respective device from where you can manually add your devices.
Once you click the “Add” button you will be prompted to enter the following details:
Name- In this field, you have to provide a name of the Switch.Management IP- Here, you need to provide IP address of the Switch for management of device.Manufacturer- You have to select the manufacturer from the drop-down list available here.Model- In this field, you have to select the model from the drop-down list available here.Data Center- You can select the data center in which the switches are hosted.Private Cloud- Select the private cloud from the available drop-down.Cabinet- Choose the cabinet from the data center you selected earlier.Position- You can enter the position of the device, inside the cabinet from this field.Size- Here, you can enter the size of your device.Asset Tag- If you have already created an Asset Tag, you enter the same from here.Enter a new Tag- This option can be used to create a new Tag.
Click on the "Submit" button to successfully add your device to the platform.
Once you click the “Add” button you will be prompted to enter the following details:
Name- In this field, you have to provide the name of the Firewall.Management IP- Here, you need to provide the IP address of the Firewall for the management of device.Manufacturer- You have to select the manufacturer from the drop-down list available here.Model- In this field, you have to select the model from the drop-down list available here.Data Center- You can select the data center in which the switches are hosted.Private Cloud- Select the private cloud from the available drop-down.Cabinet- Choose the cabinet from the data center you selected earlier.Position- You can enter the position of the device, inside the cabinet from this field.Size- Here, you can enter the size of your device.Asset Tag- If you have already created an Asset Tag, you enter the same from here.Enter a new Tag- This option can be used to create a new Tag.
Click on the "Submit" button to successfully add your device to the platform.
Once you click the “Add” button you will be prompted to enter the following details:
Name- In this field, you have to provide the name of the Load Balancer.Management IP- Here, you need to provide the IP address of the Load Balancer for the management of device.Manufacturer- You have to select the manufacturer from the drop-down list available here.Model- In this field, you have to select the model from the drop-down list available here.Data Center- You can select the data center in which the load balancers are hosted.Private Cloud- Select the private cloud from the available drop-down.Cabinet- Choose the cabinet from the data center you selected earlier.Position- You can enter the position of the device, inside the cabinet from this field.Size- Here, you can enter the size of your device.Asset Tag- If you have already created an Asset Tag, you enter the same from here.Enter a new Tag- This option can be used to create a new Tag.
Click on the "Submit" button to successfully add your device to the platform.
Once you click the “Add” button you will be prompted to enter the following details:
Name- In this field, you have to provide the name of the Hypervisor.Management IP- Here, you need to provide the IP address of the Load Balancer for the management of device.Manufacturer- You have to select the manufacturer from the drop-down list available here.Model- In this field, you have to select the model from the drop-down list available here.Data Center- You can select the data center in which the hypervisor is hosted.Private Cloud- Select the private cloud from the available drop-down.Cabinet- Choose the cabinet from the data center you selected earlier.Position- You can enter the position of the device, inside the cabinet from this field.Size- Here, you can enter the size of your device.Virtualization Type- You can select the virtualization type of your hypervisor from the available drop-down.Asset Tag- If you have already created an Asset Tag, you enter the same from here.Enter a new Tag- This option can be used to create a new Tag.Activate Management Web Console- To activate the management via the web console, you need to enter the web URL to manage access.
Click on the "Submit" button to successfully add your device to the platform.
Once you click the “Add” button you will be prompted to enter the following details:
Name- In this field, you have to provide the name of the bare-metal server.Management IP- Here, you need to provide the IP address of the bare-metal server for the management of the device.Manufacturer- You have to select the manufacturer from the drop-down list available here.Model- In this field, you have to select the model from the drop-down list available here.Number of CPUs- You can enter the number of underlying CPUs of the added bare-metal server.Number of Cores- Here, you can enter the number of cores inside the CPU.Memory (MB)- In this section, you have to enter the memory of the CPU.Capacity (GB)- You have to fill the capacity of the Bare-Metal in this field.Data Center- You can select the data center in which the bare-metal servers are hosted.Private Cloud- Select the private cloud from the available drop-down.Cabinet- Choose the cabinet from the data center you selected earlier.Position- You can enter the position of the device, inside the cabinet from this field.Size- Here, you can enter the size of your device.OS- From the drop-down, select the operating system of the bare-metal server.Asset Tag- If you have already created an Asset Tag, you enter the same from here.Enter a new Tag- This option can be used to create a new Tag.Bare-Metal Controller Type- Here you can select the type of controller available from the drop-down list.
Click on the "Submit" button to successfully add your device to the platform.
Once you click the “Add” button you will be prompted to enter the following details:
Name- In this field, you have to provide the name of the Mac mini.Serial Number- Enter the serial number of your respective Mac mini device here.OS- From the drop-down, select the operating system of the Mac miniManufacturer- You have to select the manufacturer from the drop-down list available here.Model- In this field, you have to select the model from the drop-down list available here.Number of CPUs- You can enter the number of underlying CPUs of the added Mac miniNumber of Cores- Here, you can enter the number of cores inside the CPU.Memory (MB)- In this section, you have to enter the memory of the CPU.Capacity (GB)- You have to fill the capacity of the Mac mini in this field.Management IP- Here, you need to provide the IP address of the Mac mini for the management of the device.Data Center- You can select the data center in which the Mac minis are hosted.Private Cloud- Select the private cloud from the available drop-down.Cabinet- Choose the cabinet from the data center you selected earlier.Position- You can enter the position of the device, inside the cabinet from this field.Size- Here, you can enter the size of your device.Asset Tag- If you have already created an Asset Tag, you enter the same from here.
Once you click the “Add” button you will be prompted to enter the following details:
Name- In this field, you must provide the name of the storage device.Management IP- Here, you need to provide the IP address of the storage device for management.Manufacturer- You have to select the manufacturer from the drop-down list available here.Model- In this field, you have to select the model from the drop-down list available here.Data Center- You can select the data center in which the storage devices are hosted.Private Cloud- Select the private cloud from the available drop-down.Cabinet- Choose the cabinet from the data center you selected earlier.Position- You can enter the position of the device, inside the cabinet from this field.Size- Here, you can enter the size of your device.Virtualization Type- You can select the virtualization type of your hypervisor from the available drop-down.Asset Tag- If you have already created an Asset Tag, you enter the same from here.Enter a new Tag- This option can be used to create a new Tag.
Click on the "Submit" button to successfully add your device to the platform.
Once you click the “Add” button you will be prompted to enter the following details:
Account Nam- You have to enter your email ID associated with your account.Access Key- Enter your unique access key ID provided by your service provider.Secret Key- Enter the private key to provide root access of your account.End-point URL- Provide the URL of your S3 account.Private Cloud- Select the associated private cloud for the S3 account from the drop-down.
Click on the "Submit" button to successfully add your device to the platform.
Using UnityOne
UnityOne is a comprehensive cloud management platform (CMP) that assists you with the management of data centers, public cloud, and private cloud from a unified dashboard.
You can add your customized logo at the top of the menu bar by contacting the UnityOne support team.
Every page has a navigation bar at the top that shows you which page you are currently on.
You can report an issue by clicking the button (logo) in the top right corner, which will prompt a popup. Fill out the information below to report an issue with the Unity support team:
Subject Line- In this, you will get a default subject line that includes the navigation path.CC- Here, you can add any email address to notify anyone about the issue.Priority- You can select the priority levels like critical, high, normal, and low.Description- You can briefly describe your issue in this section.Meta- The UnityOne support team uses this non-editable data to understand more about the issue.Attachments- You can use this option to attach any file or screenshot, which will further help the UnityOne support team to get more clarity on the issue.Send- Once you click the send button, it will automatically raise a support ticket with the UnityOne support team.
You can use the global search feature to search the onboarded infrastructure in the UnityOne platform using keywords. To perform the search action, input the device name or tags. To conduct an advanced search, click the "Advanced Search" option in the popup window. Advanced search filters can be applied by selecting Device and OS type and entering Device Name, IP address, and Tag Name.
The notification icon is located next to the search button. It displays the number of notifications and, when clicked, displays the notifications, such as adding new virtual machines (VMs), alerts, etc.
You can also find your organization's time zone on the top right side. This can be updated from the profile settings section.
On the extreme top right, you can find a profile section from which you can access the welcome page, change your profile settings, and log out of your account.
This page will give you information about the device’s onboarding status and release notes.
From this page, you can change your password and time zone. Additionally, you can enable two factor authentication from the same page.
- Click on the manage button to start the process of two factor authentication.
- Click on “Enable Now” to set up your two-factor authentication and click “Next”.
- To enable the authentication, you need to generate a security token. You have to use a TOTP-based security token generator app on your smartphone to scan the QR code displayed on the page.
- The following TOTP client implementations are known to work:
Google AuthenticatorMicrosoft AuthenticatorDuo MobileFree OTP- Enter the generated token within the box provided below.
- Once you have verified your token, you will get a message
“Congratulations, you've successfully enabled two-factor authentication.” - In case, you wish to disable the two-factor authentication, you can do it by clicking
“Disable Two-factor authentication.”
You can add users to send alert notifications by providing a username email inside the box provided under the “Alert Notification” widget.
UnityView
UnityView provides a high-level overview of your infrastructure. This is the first section in the navigation menu of UnityOne, and it is solely purposed for the summary view of the infrastructure offering details about monitoring, health status, utilization, alerts & ticketing, etc.
Navigation
To navigate this section, go to Menu > UnityView. From the drop-down, you may also view other sub-sections inside of it.
Understanding sections under UnityView
Dashboard
This dashboard displays various panels indicating the status of your data centers, public and private cloud infrastructure, resource utilization, container cloud, mesh manager details, data center cabinets information, devices under management, maintenance calendar and alerts.
You can view the geographical map with the health status of your data center locations across the globe from the top panel of the dashboard.
Green status denotes that the data center is healthy– indicating that both the data center and its devices are up.Amber status denotes that the data center is partially healthy– indicating that any one of its devices inside the data center is running down.Red status denotes that the data center is unhealthy– indicating that the complete data center and its devices are down.
We have now arrived at a page displaying the summary view of the private cloud. This page will provide details of all your private cloud enrollments with UnityOne, such as VMware Vcenter, VMware Vcloud director, OpenStack, HyperV, ESXi, KVM, etc.
Each private cloud account has a unique widget that allows you to graphically monitor usage statistics for vCPU, RAM, and storage, such as:
Allocated– Number of resources required by the customerConfigured– Number of resources being consumed on-demandAvailable– Number of resources left for further consumption
For virtual machines, and alerts you can find information about the utilization percentage, used and unused VM count, and the number of alerts configured respectively.
You can procure information about all of your public clouds that are enrolled with UnityOne from this page in the next panel, which is designated for public cloud details of AWS, GCP, Azure, Oracle.
Every public cloud account has a unique widget that displays the information graphically.
Your AWS account will include the following details:
- Number of EC2 instances (including running and stopped instances)
- Number of S3 Buckets
- Number of Elastic IPs
- Number of RDS instances
- Number of Load Balancers
Your Azure account will include the following details:
- Number of VM instances (including running and stopped instances)
- Number of Storage accounts
- Number of Elastic NICs
- Number of public IPs
- Number of Load Balancers
Your GCP account will include the following details:
- Number of VM instances (including running and stopped instances)
- Volume of disk in GB
- Number of buckets
- Number of health checks
- Number of VM count
Your OCI account will include the following details:
- Number of VM instances (including running and stopped instances)
- Number of managed databases
- Number of buckets
- Number of Http monitors
- Number of VM count
This widget provides information on the nodes and pods that make up your container. A graphical representation of pods with status indicators like succeeded, running, pending, unknown, and failed can be viewed.
All container orchestrations, including Kubernetes, Docker, and Docker Swarm, are supported by UnityOne.
Major mesh managers like AWS App Mesh, GCP Anthos, Istio, etc., are supported by UnityOne.
GCP-Anthos Traffic Director will include the following details:
- A graphical representation that shows the health status of the mesh manager with metrics such as Healthy, Partially Healthy, Unhealthy, and No Backends.
- In the adjacent section, you will find the number of services and routing rule maps assigned to the mesh manager.
Istio mesh manager will include the following details:
- A graphical representation that shows the health status of the mesh manager with metrics such as succeeded, running, pending, and failed services.
- In the adjacent section, you will find the number of pods and destination rule maps assigned to the mesh manager.
AWS App mesh manager will include the following details:
- A graphical representation that shows the health status of the mesh manager with metrics such as active, inactive and deleted services.
- In the adjacent section, you will find the number of mesh services and routes assigned to the mesh manager.
In this panel, you will find a front view of different cabinets inside a data center from where you can visually gain insight into details like:
- Number of that are devices up and down
- Number of configured alerts,
- Utilized/available rack units
- Measurement of the temperature inside the cabinets
- Status of power sockets (configured/not configured)
- Total power consumption, and carbon emissions of a data center location
The number of devices under-management are listed here, it displays the count of devices under management for assets like cabinets, PDUs, firewalls, pods, switches, virtual machines, etc.
This status of devices under management is shown graphically using color-coded indicators:
Green denotes upRed indicates downGrey signifies no monitoring configuration
A calendar view of all your scheduled maintenance is accessible here.
In this panel, you may find all the devices configured for altering, and also view the number of devices configured for alerts.
The dashboards section of ticket management includes different tabs from where you can view different types of tickets raised, such as:
All Tickets– Includes the details of all types of raised tickets.Change Tickets– Includes the details of tickets raised for “Change Requests.”Incident Tickets– Includes the details of tickets raised for requesting the incident changes.Problem Tickets– Includes the details of tickets raised for informing client problems at the platform.Question Tickets– Includes the details of tickets raised on questions or queries raised by the clients.Request Tickets– Includes the details of customer request tickets.
All these tabs include the information ticket ID, short description, status, status reason, priority, created on, and updated on.
Monitoring
UnityOne facilitates you with two monitoring options:
Agentless (Basic Monitoring)Agent Based (Advanced Monitoring)
Single Device Monitoring can be configured on a device basis, and this can be done from several other pages
There are different ways to configure monitoring for a single device within the platform. One way is outlined below:
Navigate to Menu > UnityOne > Private Cloud
You will find various devices listed under the private cloud.
Head to the action button menu, select "Configure Monitoring," and fill in the required details, such as connection type (SNMP or Agent). If it’s SNMP, you need to enter the following details:
SNMP IP – IP address of the device on which SNMP is configured
SNMP Protocol Version – There are 3 types of protocol versions available:
SNMP v1:This is the first version of protocol which is easy and simple to setup while requiring only a plain text community.SNMP v2c:It is a sub-version of SNMP v2, which has enhancements and security with protected passwords that your device needs to communicate and transfer information when an SNMP request occurs.SNMP v3:It is the newest version of SNMP, which is the most secure of all the SNMP versions that supports frameworks like authentication, encryptions, and decryptions.
After you have selected your preferred choices, click on “Submit.”
If the monitoring is Agent-Based, you can download and install it on the server to enable monitoring. Once installed, you must enter the required IP address and click "Submit" to activate it.
After a couple of minutes, UnityOne will fetch all the details.
Navigate to the Main Menu > UnityView > Monitoring
In this page you can observe three different tabs under monitoring section, NOC view, System, Configuration. To set up monitoring select the configuration tab.
Here you can see three different tabs under the monitoring section:
ConfigurationNOC ViewSystem
- Configuration
- This section provides detailed information on the monitoring status of each device. And suppose any of the devices monitoring is not activated. In that case, you can select it to click on edit and provide connection type (if it’s SNMP, then provide protocol version, or if it is an agent, then provide agent IP).
- Also, you can select multiple devices as well. You can choose the device for which you want to enable monitoring, click on edit, provide the relevant SNMP details and activate the monitoring. You may also use the available filters to narrow down your search based on parameters like SNMP version, device type, or even through keywords.
- This configuration window also has a tabular column with action buttons that provides device name, type, management IP, SNMP IP and Version, Community String, and authentication level details.
- NOC View
- By default, the page will be blank. To set up the configuration of the NOC view, the first step is to create a group. To create a group, follow the instructions given below:
- Click on the “Pencil” icon from the top right corner
- Click on the option, “Add Group”
- Enter the name and short description of your group
- Click on “Submit” to create a group
- Once your group is successfully created, you can add your devices to that particular group by clicking on the + icon (Add new device).
- Adding a new device to the NOC view
- Select the preferred device category from the drop-down.
- Select the device list from the existing devices from the above-mentioned category and click on “Add”.
- You can follow the same process to add any new device into the NOC view.
- This section visually tracks all of the enabled devices graphically, displaying the status (green for uptime, orange for downtime) and the number of faults, all from a single dashboard.
- System
- This page displays the monitoring charts and graphs for devices such as firewalls, PDUs, hypervisors, switches, etc. This section acts as a dashboard to view all the graphs configured for monitoring. You can add your graphs to this section by following the steps below:
- To add widgets, click on “Add widget” from the top.
- Select the device type and the device list from the drop-down
- Select the available graph list from the drop-down.
- Click on “Submit”
It will take a few minutes to fetch and display the graphs on this page.
Note You can only select the graphs that are already created for the device from the configuration section.
If you need help setting up graphs for monitoring, navigate to:
Menu > UnityOne > Private Cloud > Device Name > Device Statistics
Here you can find an option to “Create Graph” from where you can create your own graphs by providing the following details:
Graph Name: You can enter your choice of graph name.Select Graph Type: You can select a graph type such as normal, stacked, pie, or exploded.Items: From here you can select different metrics that you might be interested to monitor any graphical view.
Activity Log
The activity log keeps information about all the actions undertaken by different users within your organization. Also, it records the changes made so that these logs can be viewed whenever needed.
This page by default displays the activity logs for the past 15 days.
You can check the activity logs for any specified date range by selecting a date range from the calendar to view the relevant activity logs.
You can also download your data as an Excel spreadsheet by clicking the "Download" button on the right.
In this section, you can select a date range to modify your preferences and view the relevant activity logs accordingly. You may download your data as an excel sheet by using the download option on the right side.
The present screen will display information such as the entity type and name, the user's email address, action, the source IP address, and the time of action performed.
Click on "Changes" to see the following information:
- ModelName
- User
- Impersonated By
- Action
- A table displaying details like field and value
Alerts
This Alerts Section will allow you to navigate to three other tabs; Alerts Tab, History Tab, and Graphs Tab.
We have now arrived at the “Alerts” page. All active alerts from the UnityOne monitoring system based on configured triggers within the platform are visible on the alerts page. You may view all the device's alerts here, including switches, firewalls, load balancers, hypervisors, bare metal servers, Mac minis, virtual machines, storage, PDU, and others.
To access comprehensive dashboards with three different tiles, click the Alerts tab. Information such as Total Alerts, Critical Alerts, Warning Alerts, and Information Alerts are presented in the first grid.
You can view a pie chart in the second grid that shows statistics focused on Device Type - Alerts Percentage (%).
In the second grid, you can view a pie chart that is formed based on Device Type and Alerts percentage. This will give you insights into the percentage of alerts configured on each device level, and this will also help you understand the statistics of devices and their respective alert percentage in the ecosystem.
The number of alerts configured at the device level is shown in the third grid.
When you scroll down, you'll see a tabular form with extensive information about alerts, including the Device Name and Types, Management, Severity Levels (Orange denotes warning, red is critical, and blue denotes information), Description, and Time of the Alert, Status of Acknowledgement (Yes/No), Recovery Time, and Duration.
Action Buttons
Acknowledgment– From this action button, you can acknowledge the alertChange Severity– You can use this action button to change the levels of severity manually.Close Problem– This action button will help you to close the alert.Management IP– This action button will help you to remotely connect to the deviceCreate Ticket– From here, you can generate a support ticket for the alert
Once the raised alert is closed or resolved it will be displayed under the alerts tab for 10 mins and later it will be moved to the history tab automatically. Similar to the tabular column featured in the Alerts tab, the history tab also offers access to filters like start date and end date, as well as keyword and device type search selections. Once you are satisfied with your selections, click the update button to view the history according to your preferences.
"Graphs" is another tab on the "Alerts" page. This tab will present charts that graphically represent the alerts and provide information on various alert combinations. Here, for all the graphs you can find the legends that reflect the data displayed in the graph's X- axis and Y-axis, with specific color codes.
Alerts by severity– This graph will display the severity level of your alerts.Alerts by severity trends– This graph will show you the comparison trends of alerts raised on the three critical levels.Top 10 devices by alerts– This graph will display the top 10 devices as per severity levels.Top devices by alerts– This graph will display the comparison among the top devices and their severity levels.Alerts trends by data center– This graph will display the alerts based on different data center locations.
Once you have chosen your preferred filters, click the update button to see the results. You can also apply filters based on time, start date, and end date.
Network Topology
This is a page where you can find a graphical representation of the network topology of your entire organization’s architecture. You can graphically view your infrastructure’s network nodes and corresponding neighboring devices. The main functionality of this page is to display the whole network hierarchical tree from a single dashboard view.
You can group the network topology by data center, private cloud, and all devices from the top left-hand corner.
UnityCloud
Private Cloud
What is Private Cloud ?
A Private Cloud is a computing environment dedicated to a single organization and not shared with any other parties. It provides the benefits of cloud computing, such as scalability and on-demand access to resources, while ensuring greater control, security, and privacy over the infrastructure and data. Private clouds are typically implemented within an organization's data center or through a third-party service provider that offers dedicated single-tenant environments.
Types of Private cloud Virtualizations
UnityOne supports different types Private Cloud virtualizations mentioned below:
VMwareVCloud DirectorOpenStackProxmoxG3 KVMHyper-VESXiCustom
To navigate this section, go to Menu > UnityCloud. Select “Private Cloud” from the drop-down to view the management page. Note that you must grant Read access using the UnityOne API when integrating Private Clouds with UnityOne. Moreover, a data center setup within UnityOne is mandatory
To add a Private Cloud into UnityOne, you should have an associated data center onboarded within the platform. In case you want to add a new data center, follow the steps below:
Add a Data Center
Navigate to Menu > UnityCloud > Data Center When you click on the three dots (︙) in the top right corner, you will find options like “Add”, “Edit”, and “Delete”. Click on “Add” and follow the instructions below:
Name– Enter the preferred name of your data center.Location– Once you enter the location, you will find it in the available drop-down
Note If you get an error after clicking submit, please ensure again that all the provided information is correct and if the issue still persists, contact the UnityOne support team.
Integrate a Private Cloud into UnityOne
Simply click on the three dots (︙) in the top right corner to add your Private Cloud.
Mandatory data to add a Private Cloud into UnityOne
Select your cloud type (VMware, VCloud Director, OpenStack, Proxmox, G3 KVM, HyperV, ESXi, or any other)
Cloud Type - VMware
Cloud Name– Here you have to enter the name of your cloud.Data Center– Select a data center from where your Private Cloud is located.Host Name– Here, you have to enter a Fully Qualified Domain Name (FQDN) or the IP of VCenter host.Username– Enter your username here to connect to the VCenter (The Login should have a minimum of read access to the VCenter).Password– Enter your password here to connect to the VcenterResource Pool Name (Optional)– If you have any resource pool created, enter the details here.
Click on “Submit” to automatically add your Private Cloud to the platform.
Note If you get an error after clicking submit, please ensure again that all the provided information is correct and if the issue still persists, contact the UnityOne support team.
Cloud Type -VCloud Director
Cloud Name– Here you have to enter the name of your cloud.Data Center– Select a data center from where your Private Cloud is located.VCloud URL– Here, you have to enter your VCloud URLUsername– Enter your username here (You can use the same username as shown on the Private Cloud service provider).Password– Finally, enter your password here (You can use the same password which was set for accessing the Private Cloud).Organization– You have to enter the name of your organization here.
Click on “Submit” to automatically add your Private Cloud to the platform.
NoteIf you get an error after clicking submit, please ensure again that all the provided information is correct and if the issue still persists, contact the UnityOne support team.
Cloud Type – OpenStack
Cloud Name– Here you have to enter the name of your cloud.Data Center– Select a data center from where your Private Cloud is located.Auth URL– Here, you have to enter the URL of your OpenStack account authenticationUsername– Enter your username here (You can use the same username as shown on the Private Cloud service provider).Password– Finally, enter your password here (You can use the same password which was set for accessing the Private Cloud).Project– Here, you need to provide the project name of your accountUser Domain– Here you have to enter the user name of your project.Project Domain– Here, you need to enter the domain address of your project.
Cloud Type – Proxmox
Cloud Name– Here you have to enter the name of your cloud.Data Center– Select a data center from where your Private Cloud is located.Host Address– Here, you have to enter your host address.Username– Enter your username here (You can use the same username as shown on the Private Cloud service provider).Password– Finally, enter your password here (You can use the same password which was set for accessing the Private Cloud).
Click on “Submit” to automatically add your Private Cloud to the platform.
NoteIf you get an error after clicking submit, please ensure again that all the provided information is correct and if the issue still persists, contact the UnityOne support team.
Cloud Type – G3 KVM
Cloud Name– Here you have to enter the name of your cloud.Data Center– Select a data center from where your Private Cloud is located.Host Address– In this field you have to, you have to enter your host address.Username– Enter your username here (You can use the same username as shown on the Private Cloud service provider).Password– Finally, enter your password here (You can use the same password which was set for accessing the Private Cloud).
Click on “Submit” to automatically add your Private Cloud to the platform.
NoteIf you get an error after clicking submit, please ensure again that all the provided information is correct and if the issue still persists, contact the UnityOne support team.
Cloud Type – hyper V
Cloud Name– Here you have to enter the name of your cloud..Data Center– Select a data center from where your Private Cloud is located.Host Address– Here, you have to enter your host address.Username– Enter your username here (You can use the same username as shown on the Private Cloud service provider).Password– Finally, enter your password here (You can use the same password which was set for accessing the Private Cloud).Password– Here you have to enter the organizational domain name server address where the data center is hosted.
Cloud Type – ESX
ESXi is one of the primary components in the VMware infrastructure software suite which is a Type 1 bare-metal hypervisor, that runs directly on system hardware without the need for an OS.
NoteIf you have multiple standalone ESXi hosts, you can combine them to create a Private Cloud. You can also register the hosts to manage and monitor them together from the platform.
Cloud Name– Here you have to enter the name of your cloud.Data Center– Select a data center from where your Private Cloud is located.
Click on “Submit” to automatically add your Private Cloud to the platform.
NoteIf you get an error after clicking submit, please ensure again that all the provided information is correct and if the issue still persists, contact the UnityOne support team.
Once you add these details, it will take you to the Hypervisor tab where you have to register the standalone ESxi Hypervisor. After the Hypervisor is added, it will discover the Virtual machines and for each host automatically.
Cloud Type – Custom
If you want to onboard individual virtual machines, you can use a custom cloud. Once you create a custom cloud, navigate to the Virtual machine tab and add them individually to the cloud.
Cloud Name– Here you have to enter the name of your cloud.Data Center– Select a data center from where your Private Cloud is locat
Click on “Submit” to automatically add your Private Cloud to the platform.
NoteIf you get an error after clicking submit, please ensure again that all the provided information is correct and if the issue still persists, contact the UnityOne support team.
Now that you have configured your Private Clouds, UnityOne will give you details to monitor and manage your assets.
You can access the newly created Private Cloud accounts by navigating the tabs at the top of the Private Cloud page.
Let’s now explore the various widgets available in your Private Cloud accounts.
In the present screen, you can observe three sections.
The first section displays information about the cloud's name, virtualization platform, the number of installed hypervisors, provisioned virtual machines, and
Action buttons
If you want to onboard individual virtual machines, you can use a custom cloud. Once you create a custom cloud, navigate to the Virtual machine tab and add them individually to the cloud.
EditYou can edit the information of your added Private Cloud from this button.Delete– You can deregister or unmap your added Private Cloud from this button platform.Manage by creating a support ticket– From this action button, you can manage your Private Cloud by raising a ticket with the support team.
The next section presents a component summary, which covers information on the various components in your Private Cloud, such as the number of hypervisors, bare metals, virtual machines, containers, storage devices, Mac mini, switches, firewalls, load balancers, and so on. The final widget will display progress bars that display the graphical view of vCPU, RAM, and storage disks from where you can find information on:
ConfiguredThis indicates the total number of resources configured on Virtual machinesAvailable– This indicates the total number of resources that are availableAllocated– This indicates the total number of resources allocated for the customer on this cloud.
All Devices
This section will have details on the “All Devices” tab of UnityOne
The current screen shows you information about your hypervisors, firewalls, load balancers, switches, bare metals, and virtual machines. You can also access details about a specific component, including Device Name, Status, Alerts, statistics, and status indicators.
Green status indicator denotes that the device is upRed status indicator denotes that the device is down
UnityOne can manage and monitor all your switches manufacturers.
This page shows the switch's name, status indicator, model and type, management IP, and associated tags.
NoteTo add a new Switch to this cloud, you have to go to the “Devices” page and then add a Switch.
Action Buttons
Manage in the same tab:This action button will assist you to manage the devices via SSH in the same tab (as a floating terminal)Manage in the new tab:This action button will help you to manage your SSH in the new tabSwitch statistics:You can get advanced monitoring data of the switch from this action buttonManage by creating support ticket:From this action button, you can manage your hypervisor by raising a ticket with the support team.
UnityOne can manage and monitor all your firewall manufacturers.
This tab will give you details about the name of the firewall, status indicator, model and type, management IP, and associated tags.
NoteTo add a new firewall to this cloud, you have to go to the “Devices” page and then add a Switch.
Action Buttons
Manage in the same tab:This action button will assist you to manage the devices via SSH in the same tab (as a floating terminal)Manage in the new tab:This action button will help you manage your SSH in two ways. The first one is via web access which redirects to the web portal for management. The other is via console access which redirects you to the command terminal for device management. (If your web access is not configured, you can request web access from UnityOne support by clicking on the ‘Request web access’ button).Firewall statistics:You can get advanced monitoring data of firewalls from this action buttonManage by creating support ticket:From this action button, you can manage your firewalls by raising a ticket with the support team.
UnityOne can manage and monitor all your load balancer manufacturers.
This screen will give you information about the load balancer's name.
In this tab, you will find details about the load balancer's name, status indicator, model and type, management IP, and associated tags.
Action Buttons
Manage in the same tab:This action button will assist you to manage the devices via SSH in the same tab (as a floating terminal)Manage in the new tab:This action button will help you manage your SSH in two ways. The first one is via web access which redirects to the web portal for management. The other is via console access which redirects you to the command terminal for device management. (If your web access is not configured, you can request web access from UnityOne support by clicking on the ‘Request web access’ button).Load Balancer statistics:You can get advanced monitoring data of the switch from this action button.Manage by creating support ticket:From this action button, you can manage your load balancers by raising a ticket with the support team.
When your Private Cloud is registered with UnityOne, hypervisors are automatically discovered.
This screen will give you access to Hypervisoes under the specific Private Cloud, a health status indicator (red for down, green for up), the virtualization type of respective hypervisors, operating system details, management IP, and associated tags.
Action Buttons
Manage in the same tab:This action button will assist you to manage the devices via SSH in the same tab (as a floating terminal)Manage in the new tab:This action button will help you manage your SSH in two ways. The first one is via web access which redirects to the web portal for management. The other is via console access which redirects you to the command terminal for device management. (If your web access is not configured, you can request web access from UnityOne support by clicking on the ‘Request web access’ button).Hypervisor statistics:You can get advance monitoring data from this action button.Manage by creating support ticket:From this action button, you can manage your hypervisor by raising a ticket with the support team.
This page displays details of bare metal servers, which gives you critical information like server name, status, operating system, management IP, and tags.
Action Buttons
Power on/off:You can use this action button to start or stop your Bare Metal serversManage in the same tab:This action button will assist you to manage the devices via SSH in the same tab (as a floating terminal)Manage in the new tab:This action button will help you manage your SSH in two ways. The first one is via web access which redirects to the web portal for management. The other is via console access which redirects you to the command terminal for device management. (If your web access is not configured, you can request web access from UnityOne support by clicking on the ‘Request web access’ button).Bare Metal statistics:You can get advance monitoring data from this action button.Manage by creating support ticket:From this action button, you can manage your bare metal servers by raising a ticket with the support team.Alert Notification:This action button will assist you to enable or disable alerts notification.Server Info:This action button will help you to provide you server informationEdit:You can edit the details with this action buttonDelete:This action button will assist you to delete your bare metal serverRemote Blinker:This action button will assist you to blink the server in the data centerIPMI Stats:This action button will help you to observe IPMI statsReset IPMI password:You can reset the password of IPMI with this action button
This page will give you information on the Mac Mini details such as device name, status, serial number, operating system, management IP, Asset tag, and tags.
Action Buttons
Manage in the same tab:This action button will assist you to manage the devices via SSH in the same tab (as a floating terminal)Manage in the new tab:This action button will help you manage your SSH in two ways. The first one is via web access which redirects to the web portal for management. The other is via console access which redirects you to the command terminal for device management. (If your web access is not configured, you can request web access from UnityOne support by clicking on the ‘Request web access’ button).Mac Mini statistics:You can get advance monitoring data of mac mini devices from this action button.Manage by creating support ticket:From this action button, you can manage your hypervisor by raising a ticket with the support team.Alert Notification:This action button will assist you to enable or disable alerts.Device Info:This action button will provide you with Device informationEdit:This action button will help you to edit the detailsDelete:You can delete your Mac Mini device from this action button
Once you register your Private Cloud into UnityOne, your VMs running on the respective Private Cloud will be automatically fetched into the platform. A VM is a Virtual Computer that runs programs and deploys apps on your cloud ecosystems. With multiple VMs hosted across various Private Cloud locations, managing VMs without a unified VM management feature is often complex. Here, we offer customers a centralized VM management dashboard where admins can view and manage all VMs from a single window.
In this section, you can perform the following actions:
Names:Names of your Virtual Machines on UnityOneHealth status indicator:This indicates the status of the VM whether it is up or down (red for down, green for up)Type of your VM:This button will give you the details on whether it is a Virtual Machine or a TemplateOperating system details:This will give details on the OS running on the Virtual MachineTags:Here you can add tags to the VMs (any number of tags can be added to a single VM)
Action Buttons
UnityOne has multiple actions in this tab. You can click on the icons mentioned below to perform various actions:
Power on/off- Once you click on this, you will be asked to provide the Private Cloud credentials then you can use this action button to start or stop your VMCreate VM:This action button will help you create a new VM directly from UnityOneManage in same tab– This action button will assist you to manage the devices via SSH in the same tab (as a floating terminal)Manage in new tab– This action button will help you to manage the device via SSH in the new tabWeb console– This action button help you get VM console access.Virtual machine statistics– From this action button, you can get advanced monitoring data of your VM. This action button will help you configure monitoring if it’s not activated yet. (If the monitoring is already configured, then it will show you the statistics)Manage by creating a support ticket– From this action button, you can manage your VMs by raising a ticket with the support team.
Click on the three-dotted icon ( ... ) to find other actions listed below:
Edit Settings– This action button will assist you to edit your VM Properties.Clone VM– You can use this action button to replicate a VMReboot VM– This action button will help you to reset your VMVM info– Use this action button to get server details of the VMShutdown Guest OS– This action will help you in turning off the OS.Mount VMware tools– This action button will help you mount VMware tools.VM info– This action button will help you to get server details of your VM.Update management IP- You can action button to update the IP of a VM (The IP address of the VMs will not be visible if VMware tools are not installed; in that case, you can manually update the VM IP to the Unity database, which will help you remotely manage the VM)Update tag– Use this action button to update a VM with another tag.
Containers are a lightweight and portable way to package and run applications with their dependencies, such as libraries and settings, isolated from the underlying host system. Containers encapsulate the application and its dependencies into a single, self-sufficient unit that can run consistently across different environments, including development, testing, staging, and production.
This page will display the details configured container orchestrations setup added to UnityOne platform such as Docker, Kubernetes which include information like the container name, type, Host URL, and Action buttons
Against each container orchestration you will find the action buttons which help you fetch information on nodes and its associated container
Action Buttons
Show Details:It will take you the details page where you can find two different tabs namely nodes and containers
Nodes Tab
In this nodes tab you can find the information of asscoaited master and slave nodes which includes hostname, node ID, node status, IP address, CPU, memory, OS, and few action buttons.
Open in same tab:This action button will assist you to open the nodes via SSH in the same tab (as a floating terminal)Open in new tab:This action button will help you to open the nodes via SSH in the new tab
Containers Tab
In this tab you will find the information on containers within the nodes and its details include: Name, image, status, CPU and memory usage.
Change Password:You can change your container password by providing different files such as the client certificate, Client Key, and Client CA.Edit:You can use this button to edit your container details such as controller type, name, host name, client certificate, Client Key, and Client CA.Delete:You can delete your container from this platform by using this button.Manage by creating a support ticket:From this action button, you can manage your hypervisor by raising a ticket with the support team.
In this page, you can find the details of your storage devices such as name of the device, status of the device (red for down and green for up), Operating System details, Management IP, Storage utilization details and tags
Action Buttons
Manage in the same tab- This action button will assist you to manage the devices via SSH in the same tab (as a floating terminal)Manage in new tab- This action button will help you to manage the devices via SSH in the new tab.Storage statistics– You can get advance monitoring data of storage devices from this action button.Manage by creating a support ticket– From this action button you can manage your storage devices by raising a ticket with the support team.
S3 storage is also known as object storage, a data storage architecture for storing unstructured data, which sections data into units and objects while storing them in a flat structural environment. Every object includes data, metadata, and a unique identifier that applications can use for easy access and retrieval.
How to register or onboard your object storage into Unity
Click on the ‘Add account’ button from the top right-hand side corner, fill in the mandatory information.
Mandatory Information:
Account Name:In this field, you have to enter the name of the registered object storage account.Access Key:In this field, you have to enter your access key details provided by the object storage provider.Secret Key:In this field, you have to enter the secret key details shared by AWSEndpoint URL:In this field, you have to enter the end point of your object storage.Private Cloud:Select the associated Private Cloud from the available drop-down. If the above input details are a part of any specific cloud, then select the same from here.
Click ‘Submit’ to add your Object storage to UnityOne.
NoteIf you get an error after clicking submit, please ensure again that all the provided information is correct and if the issue still persists, contact the UnityOne support team.
Action Buttons Functionality
Show buckets– Use this action button to view buckets present in the S3 accountChange API Keys– This action button will help you to change your API keysEdit– You can use this action button to edit your S3 account details which will be made available to you at the time of onboarding or registering.Manage by creating a support ticket– From this action button, you can manage your hypervisor by raising a ticket with the support team.Delete account– You can use this action button to delete your S3 account from UnityOne.
How to add a Database to UnityOne
Click the "Add Database" button to onboard or register your database into the UnityOne platform. A new pop window will open with the fields which need to be filled with the below information for onboarding the instance.
Select server type:Select the server on which your database instance is hosted (Virtual Machine or Bare Metal). Suppose your server type is bare metal; select the server name from the drop-down (ensure that you have onboarded the server into the platform before). If your server type is Virtual Machine, select the Private Cloud and VM from the respective drop-downs.Database instance name:Enter the name of database instance.Select database type:In this field, you have to select your database type (MySQL, Microsoft SQL Server, Oracle, PostgreSQL) from the drop-down.Assign a port number:You have to enter the port number on which your database instance is configured.Enter a new tag:This button will help you add a new tag.
Click on ‘Submit’ to successfully add your database instance to UnityOne platform.
NoteIf you get an error after clicking on submit, ensure that all the provided information is correct and if the issue still persists, contact the UnityOne support team.
Once you onboard the Database instance, you can manage the same using multiple actions buttons.
Action Button Functionality
Manage in same tab– This action button will assist you to manage the devices via SSH in the same tab (as a floating terminal)Manage in new tab– This action button will help you manage the devices via SSH in the new tabStorage statistics– Click on this button to activate monitoring for a newly added database instance.Manage by creating a support ticket– From this action button, you can manage your storage devices by raising a ticket with the support team.
Click on the three dots icon (...) to view more actions
Edit– Use this action button to edit the details of your Databases instance which are provided at the time of onboarding.Delete– This action button will help you delete a database instance from UnityOne
Public Cloud
A Public cloud is a type of computing where resources are offered by a third-party provider via the internet and shared by organizations and individuals who want to use or purchase them.
Note All major public clouds are supported within the UnityOne platform.
From your left menu panel, navigate to UnityCloud > Public Cloud to onboard and manage public cloud subscriptions.
To integrate a public cloud subscription with UnityOne, you must provide the subscription details while registering with the platform.
The public cloud module is user-specific, and every user should register the subscription explicitly to View, manage, and monitor the Public Cloud services through the UnityOne platform.
How to add a public cloud into UnityOne
You can add your public cloud subscriptions by clicking on the 'Add account' button in the upper right of the page.
The UnityOne platform's current version supports integration with AWS, Microsoft Azure, Google Cloud Platform (GCP), and Oracle Cloud Infrastructure (OCI) subscriptions. If you do not see the Public Cloud provider in the list and would like it to be integrated with the platform, please raise a support request.
This module will help you to add or register your AWS subscription with the UnityOne portal. You can add as many subscriptions to the module to get a consolidated view of the services and also to manage & Monitor the same.
AWS subscriptions are integrated via API, and valid API keys should be generated for your account to register with the platform.
This segment contains information about your AWS account, including options like assigned user names and account names and a region selection.
Note AWS cloud services are only accessible after specifying your region from the drop-down list of available regions since AWS cloud is managed per region.
How to Add a AWS account into UnityOne
To Register your AWS subscription, click on ‘Add Account’ and fill out the form with the required information. Details are given below:
Account Name (Enter a user-friendly account name to differentiate the subscriptionsAccess Key (Enter the Access Key of your AWS account)Secret Key (Enter the Secret key of your AWS account)
Note To generate the AWS access key and secret key, follow the instructions written below:
Login to your AWS IAM consoleOn the navigation menu select usersChoose your IAM user nameOpen the security credentials tabChoose ‘Create Access Key’Once the access key is generated, click on ‘Show’ to view your Access key ID and Secret KeyYou can also download the key pair by clicking on ‘Download.csv file’
Actions Buttons
Show Inventory:This button will give you the details on all the subscribed services under this subscription (Choose the region before you select this action).Change API Keys:This button will assist you in changing API keys by providing the Access Key and Secret Key details. Any changes in the API keys can be updated using this action button (Access Key or Secret Key are provided at the time of the registration).Edit:Use this button to edit the subscription name provided at the time of adding the subscription to UnityOne.Manage by creating a support ticket:From this action button, you can manage your storage devices by raising a ticket with the support team.Delete:Using this button, you can delete the subscription from the UnityOne portal.
Once you select the region from the regions section and click on the ‘Show Inventory’ icon. All the cloud resources subscribed to your AWS account will be displayed on the page.
UnityOne supports the management of almost all available services on AWS, such as S3, EC2 instances, AWS ECS, Amazon EBS, Amazon RDS, Amazon VPC, Amazon Auto-scaling, Amazon Cloud Watch, and Amazon IAM, Amazon app mesh, Amazon API gateway, etc.
Note This user guide includes the widely used AWS services, but you can request us to add new services to your UnityOne portal.
Instances
You may see your EC2 instance information by clicking the instances tab. This includes the instance ID, instance type, account name associated with the VM, public IP address, availability zone, and launch time.
How to create a new EC2 instance on AWS from UnityOne
By clicking on the ‘Create Instance’ icon, one can easily create a VM instance by providing the mandatory information which are mentioned below:
Image ID- Here you have to select an option from the available drop-downAvailability Zone- Here you have to select the availability zone of the region from the drop-downInstance Type- Here you have to select the instance type from the drop-downNumber of Instances- You have to enter the count of instances hereVPC- You have to select VPC from the available drop-down hereShutdown behavior- Here you have to select the ‘Stop’ or ‘Terminate’ optionKey pair behavior- Here you have to select an option from the drop-downStorage Size- You have to enter the storage type (min 3 GiB) hereStorage Type- You have to select storage type from drop-down menu hereDelete on termination (Tick or untick the box as per your choices)Security group- Here you have to elect the security group from the drop-downTags key- You have to enter the tags key hereTags value- You have to enter the value of the tag hereTags applicable- You have to select tag applicability here
When you are satisfied with your selections, click on "Submit," and a VM instance will be created for you.
Note If you get an error after clicking submit, please ensure again that all the provided information is correct and if the issue still persists, contact the UnityOne support team.
Action buttons Functionality
Power on– This action button will assist you to switch on/off a VM. Terminate – This action button will help you to terminate a VMInstance Statistics– This action button will help you to monitor a VM.Show cloud watch statistics- This action button will show stats of a instance from AWS cloud watchManage by creating support ticket- From this action button you can manage your VMs by raising a ticket with the support team.VM info- This action button will help you to get AWS instance details.Create an image- This action button will assist you to create an image from UnityOne.Attach auto scaling group- This action button will assist you to attach an auto scaling group to a VM.Attach network interface- You ca attach a network interface from this action button.
Get the details of all the snapshots created in your AWS public cloud account, including the description of snapshots, size in GB, status, encryption, start time and progress.
Action Buttons
Copy snapshot- You can copy a specific snapshot from this action button.
This section contains information on the volumes in your AWS account, including the availability zone, encryption, volume type, size, state, IOPS, and tags.
This section details the S3 buckets you've created, such as the bucket name, region, size, and creation date. You can also create a new bucket by clicking on the “Create S3 Bucket” option.
Action Buttons
Delete- You can delete a S3 bucket from this action button.Upload a file- This action button will assist you to upload a file into the bucketUpload a file history- This action button will help you to upload the history of files.
This page shows information about each auto-scaling group, including its name, instances, availability zones, minimum, and maximum sizes, and desired capacity.
This tab makes it easier to access details about the security groups set up to secure the resources in your AWS account. The name, ID, description, VPC ID, and owner ID of the security group are all included in this dataset.
Analyze the details of your network interface, such as your AWS network interface ID, availability zone, status, MAC address, private IP address, and private DNS name.
This page displays details on the containers you have in the AWS cloud. By selecting ‘Add controller,’ you can add controllers to Kubernetes or Docker and provide the required details.
Required Details:
If your controller type is Kubernetes:
Name:In this field, you have to enter your preferred name.Host Name:In this field, you have to enter the name of the pod in which your container is running.Username:In this field, you have to enter the associated email ID.Password:In this field, you have to enter your password.
If your controller type is Docker:
Name:In this field, you have to enter your preferred name.Host Name:In this field, you have to enter the name of the pod in which your container is running.Client Certificate:Upload the client certificate configured by a directory.Client Key:Upload the client key associated with the docker.Client Certificate Authority (CA):In this field, you have to upload the certificate authority for the docker registration.
In this section you can see information about users connected to your AWS account. The user details include: Name, creation date, and Amazon Resource Names.
Action Buttons
Show user group- This action button gives you details about Group Name, Created Date, Group ID, ARN, and Path.
Microsoft Azure, often referred to as Azure, is a cloud computing platform, which offers access, management, and development of applications and services.
We have a dedicated tab under the Public Cloud Module that will give you the option to manage your Azure accounts within UnityOne.
How to add a new Azure account into UnityOne
In this section, we will explain the steps to add an Azure account to UnityOne
To add an Azure account to UnityOne, click on the ‘Add Account’ option available on the top right-hand side, then fill all the fields that are mentioned below:
Account name– You have to provide an account name of your choice in this fieldEmail– Here you have to provide the Email ID which is registered with your Azure accountPassword- In this field, you have to provide the password of your Azure accountSubscription ID- You have to provide the subscription ID of your Azure account
Click on ‘Submit’ to add your Azure account.
Note If you get an error after clicking ‘Submit’, ensure all the provided information is correct. If the issue still persists, contact the UnityOne support team.
Once your Azure account is added, you will be able to see the information of your accounts, such as acount name, Subscription ID, and other details.
A detailed explanation of each of the action buttons is given below:
Actions Buttons
View Resource Groups- Select this button to view the resource groups of your Azure account.
By performing this action, you can view the resource group name, location, and tags associated with them.
Additional Details Under Resource Groups:
Create NIC– This action button will help you to create a new NICShow inventory– This action button will show you the resources under your azure account such as VM, containers, storage, network, etc.Delete group– You can use this button to delete a resource from a group.
How to add a resource group
On the top right hand of the resource groups page, click on the ‘Add resource group,’ fill in the details such as resource group name, select location, enter a tag, and click on ‘Submit’ to create a new group.
Note If you get an error after clicking submit, please ensure again that all the provided information is correct and if the issue still persists, contact the UnityOne support team.
Google Cloud Platform (GCP) is a suite of cloud computing services that runs on the same infrastructure that Google uses internally for its end-user products, such as Google Search, Gmail, Google Drive, and YouTube.
How to add a Google Cloud account into UnityOne
To add your Google Cloud account, click on the ‘Add Account’ button, which is available on the top right-hand side of the page, and fill in the details as listed below:
Account Name– Here you have to provide a name of your choice.Email- Enter the email address associated with your Google Cloud accountService Account info- Enter the service account info which is associated with your GCP account
Click on ‘Submit’ to add your google cloud account to the UnityOne platform.
NoteIf you get an error after clicking submit, please ensure again that all the provided information is correct and if the issue still persists, contact the UnityOne support team.
Once your Google cloud account is added to UnityOne, you will find the following details:
Name of your GCP accountEmail addressProject IDRegions(a drop-down list of regions added by you in your GCP account)
You have to select a region from the drop-down section, after you select your region, you will be able to perform multiple actions, which are mentioned below:
Action Buttons
Show inventory– This button will help you to view your Google Cloud inventory of the selected region.
Once you click on ‘Show inventory,’ the page will display 3 different tabs: Virtual Machines, Snapshots, and Containers.
The Virtual Machines tab will display the details like Name, VM (Running status of VM: Red and Green), Zone, CPU Platform, Operating System, Account Name, Internal and External IP, Tags, and the following action buttons:
Action Buttons
Power:You can use this button to switch on/off your VMsManage by creating a support ticket:From this action button you can manage your VMs by raising a ticket with the Unity support team.
Snapshots
This tab will display the details of your google cloud snapshots from where you can view and manage them simultaneously.
Container
Note If the you do not have any containers added to your Google cloud account, you can do it by clicking on ‘Add Controller’ button from the top right hand side.
Once you click on add controller, you will be prompted to select the controller type (Kubernetes, Docker) and based on your choice you will be required to fill the following details:
If your controller type is Kubernetes:
Name:In this field, you have to enter your preferred name.Host Name:In this field, you have to enter the name of the pod in which your container is running.Username:In this field, you have to enter the associated email ID.Password:In this field, you have to enter your password.
If your controller type is Docker:
Name:In this field, you have to enter your preferred name.Host Name:In this field, you have to enter the name of the pod in which your container is running.Client Certificate:Upload the client certificate configured by a directory.Client Key:Upload the client key associated with the docker.Client Certificate Authority (CA):In this field, you have to upload the certificate authority for the docker registration.
From this tab, you can view the details of your containers hosted on the Google cloud platform which includes details like clusters, nodes, pods, and other related services.
Add billing details– Use this action button to add your billing detail.
Once you click on the ‘Add billing details’ button, you need to fill the mandatory data mentioned below:
Account Name:In this field, you have to enter the account name of your Google Cloud Account for which you want to add the billing details.Billing Account:You have to select the billing account details from the drop-down.Datasets:In this field, you have to select datasets.
Click on ‘Submit’ to add your billing details to the Google Cloud account successfully.
Note If you get an error after clicking submit, please ensure again that all the provided information is correct and if the issue still persists, contact the UnityOne support team.
Edit- This action button will assist you to edit your GCP Account detailsDelete account- This action button will help you to delete the GCP accountManage by creating a support ticket– From this action button you can manage your containers by raising a ticket with the support team.
Oracle Corporation provides Oracle cloud, which offers services such as storage, network, compute, and applications globally via its global network of data centers. Since it is an emerging cloud service provider, we have added OCI management under our public cloud management.
How to add an Oracle Cloud account into UnityOne
To add an Oracle cloud account to UnityOne, first, you need to click on the ‘Add Account’ button from the top right-hand side of the page; then, you will be asked to fill in the details listed below:
Name- In this field, you have to enter a user friendly name for your Oracle Cloud accountUser ID- Here you have to enter the User ID of your Oracle account.Tenancy ID- In this field, you have to enter your tenancy ID that was initially assigned to your account.Region- In this section, you have to select your region from the drop-down.Finger print- Here you have to enter your finger print details.Private Key- Here you have to upload your private key file.
After entering the details, click ‘Submit’ to add your Oracle Cloud account to UnityOne.
Note If you get an error after clicking submit, please ensure again that all the provided information is correct and if the issue still persists, contact the UnityOne support team.
In the Oracle cloud tab, once your accounts are successfully enrolled within UnityOne, you can see information about the name of your account, region, and user ID. Along with that, you are given the below action buttons to manage your account.
Action Button functionality
Show Inventory- This button will provide information about your cloud resources such as VM, storage, network interfaces, users, etc.
Once you click on ‘Show inventory,’ the page will display 3 different tabs: Virtual Machines, Users, and Storage Services.
On this page, you will find details like Name, Status (VM Running status), Image Name, Region, Availability Domain, IP Address, Tags, and the below mentioned action buttons:
Start:Use this action button to start your VM.Terminate:Use this action button to terminate or stop your VM.Update Tags:You can use this action button to edit the existing tag or add a new tag to the VM.Manage by creating a support ticket-From this action button you can manage your VMs by raising a ticket with the support team.
This page will display the details of added users such as name, email, status, email verification, and description.
Storage Services
If you haven’t created any buckets yet, you can do this by clicking on the ‘Create Bucket’ option. After you click on ‘Create Bucket’, you will have to enter the details of your bucket name.
Note The bucket name must be unique.
On this page, you will be able to view the details of your storage services including details like name, E Tag, and the following action buttons:
Show Files:This will display the files associated with the bucket (you can also delete the files from here).Delete:This action button will help you delete the bucket.Upload a file:Through this, you can upload files to the bucket.
Data center
A data center is a building or a space with dedicated servers mounted. Systems are used for storage, networking, hosting, processing data, and other business applications operating via the help of physical devices and servers. It includes switches, routers, load balancers, PDU, storage devices, etc.
Navigation
From the left-hand side menu widget, navigate to UnityCloud > Data Center from the drop-down to view the data center management page.
Data Center Page UI
You will find multiple tabs on this page with the names of available data centers added to UnityOne. You can also select them to view and manage your data center.
Once you have selected your data center, you can find tabs such as cabinets, PDUs, Private Cloud, etc.
NoteThe same applies to all the data centers.
Cabinet
From the cabinets tab, you can view, details of cabinets, such as the name of the cabinet, model, available units, capacity, and CO2 emission.
You can manage your cabinets by using the action buttons mentioned below:
Action Buttons
Edit cabinet-This action button will help you to edit your cabinet detailsDelete cabinet-This action button will assist you to delete your cabinetManage panel-This action button will help you to manage your panel (you can edit, add and delete your panels)Manage by creating a support ticket-From this action button you can manage your cabinets by raising a ticket with the support team.
How to add a cabinet into UnityOne
Navigate to the ‘Add’ button from the top-right hand side and fill in the cabinet details like:
Name:Enter a name for your cabinetModel:In this field, you have to select the model from the drop-downSize:Enter the size of the cabinet.Contract start date:Select the contract start date from the calendar grid.Contract end date:Select the contract end date from the calendar grid.Renewal:In this section, you have to enter the renewal date of your contract.Cost:Enter the cost per month.Annual escalation:Enter the percentage of escalation annually.Enter a new tag:From this section, you can create a new tag.
Now click on ‘Submit’ to successfully add a cabinet to UnityOne
NoteIf you get an error after clicking submit, please ensure again that all the provided information is correct and if the issue still persists, contact the UnityOne support team.
Cabinet View
To visualize the rear and front view of your cabinets, click on Cabinet Name, which will redirect you to a new page, and select your preferred view.
For viewing the heat map of your data center, a check box is provided on top of the page.
From the visual view of your physical cabinets, you can remotely view, monitor, and manage various devices such as firewalls, load balancers, bare metals, switches, storage, and hypervisor.
Click on the arrow mark beside the device name to view more device information. Here you will find details of manufactures, management IP, uptime, temperature, last rebooted, device type, name and model.. Additionally, you can monitor your devices from the monitoring tab.
From UnityOne, you can blink your bare metal servers in your data center remotely.
UnityOne helps technicians to locate the device in the data center with an action button (in the shape of a bulb) labeled ‘Blink Server’ in the upper right-hand corner of the bare metal server info widget (this action is only available to authorized users).
PDUs
A power distribution unit (PDU) is a device for controlling electrical power in a data center. They are designed to provide standard electrical outlets for data center equipment and have monitoring and remote access capabilities.
How to add a PDU into UnityOne
From the top right-hand corner, click on the ‘Add PDU’ button; you will be prompted to fill in the required details:
Name– Enter a name for your PDUAsset tag:Enter a tag if it existsManufacturer:Select a manufacturer from the drop-downSelect PDU model:Select the model from the drop-downSelect PDU Type (Horizontal/Vertical):Select the orientation of your PDU.Select power circuit:Select the available power circuit from the drop-down.Select cabinet:Select cabinet from the drop-down.Size:Enter the size of the PDU.Cost:Enter the cost per month.Sockets:Enter the number of sockets inside the PDU.Position:For horizontal PDU type, enter the device position in the format of numbers. For vertical PDU type, enter the device position in the format of alphabets.Device Management IP:Enter the device IP address for management.Annual escalation:Enter the percentage of escalation annually.Enter a new tag:From this section, you can create a new tag.
Click on ‘Submit’ to successfully add a PDU.
Note If you get an error after clicking submit, please ensure again that all the provided information is correct and if the issue still persists, contact the UnityOne support team.
From the PDUs tab, you can find information about the name of the PDU, status (green for up, red for down), IP address, model, cabinet location, CO2 emission value, tags and multiple action buttons to manage PDUs.
Action Buttons
Recycle– This action button will help you To recycle your PDU (only authorized users are allowed to do it)PDU info– This action button will help you to fetch your PDU detailsPDU statistics– Use this action button to provide users with advanced monitoring that includes graphs, health status, current, power, voltage, port info, and alerts.Configure socket mapping– This action button will assist you to map your PDU sockets.
From the configure socket mapping functionality, you can map the devices to your PDU socket. As soon as you click on the action button, you will see a pop-up from where you can map the required device by selecting it from the drop-down to a particular PDU socket number.
Click on “Submit” to reflect the applied socket mapping configurations.
Click on three dots (...) to view more actions
Alert Notification:This action button will help you enable alert notifications for a particular user.Manage by creating a support ticket- From this action button you can manage your hypervisors by raising a ticket with the support team.Edit- You can use this to edit details of your PDU Delete- Use this action button to delete a PDU from UnityOne
Private Cloud
In the Private Cloud module, you can view the details of your Private Cloud resources, such as VM, hypervisors, containers, switches, firewalls, load balancers, and other devices to manage your Private Cloud resources.
Note To learn how to add a private cloud, please view the Private Cloud section of this user guide.
Devices
In the Devices module, you can view, monitor, and manage all physical and virtual devices mapped into UnityOne. You can also add new devices, such as switches, load balancers, firewalls, hypervisors, bare metal servers, etc., from the same module by using CRUD operations.
We support 300+ manufacturers of physical devices, and all those supported devices can be manually entered into UnityOne.
On the devices page, you will find different tabs on the top grid; by navigating into each tab, you will view information about all your devices, such as switches, load balancers, firewalls, etc.
Note For every device, you can configure monitoring by simply clicking on the configure monitoring button that is present in each of the respective device tab. If you have already configured the monitoring you can view statistics of the device from the same action button.
A switch is a device that connects multiple devices on the same network within a data center, and it is widely used to connect servers and creates a network of shared resources.
A few of our supported switch manufacturers are Cisco, Juniper, Brocade, Dell, HP, etc.
How to add switch
At the top right-hand side of the page, you will see a button ‘Add switch’; click on it and fill in the required details below:
Name– In this field you have to enter a name for your switchPrivate Cloud– In this field, you have to select a Private Cloud from the drop-down to link your switchSelect Manufacturer- In this field you have to select a manufacturer from the drop-downModel- In this field, you have to select model from the drop-downManagement IP– In this field you have to enter a device IP address for console accessCabinet– In this field you have to select a cabinet from the drop-downPosition– In this field you have to enter the position of device in the cabinetSize– In this field you have to enter size of the deviceAsset tag– In this field you have to enter a tag if it existsEnter a new tag– In this field you have to enter a name to create a new tag
Click on ‘Submit’ to add a switch to UnityOne
Note If you get an error after clicking submit, please ensure again that all the provided information is correct and if the issue still persists, contact the UnityOne support team.
In this section, you will find details about the name of the switch, a status indicator (running status of the switch: Red indicates down, Green indicates up), model of the switch, cloud it is attached to, type of switch, and management IP and tags. Also, there are multiple action buttons.
Action Buttons
Manage in same tab– This action button will assist you to manage the devices via SSH in the same tab (as a floating terminal)Manage in new tab- This action button will help you manage the devices via SSH in two ways. The first one is via web access which redirects to the web portal for management. The other is via console access which redirects you to the command terminal for device management. (If your web access is not configured, you can request web access from UnityOne support by clicking on the ‘Request web access’ button).Switch statistics– This action button will assist you to get advance monitoring data of switchManage by creating support ticket– From this action button you can manage your Switches by raising a ticket with the support team.
Click on the three dots icon (...) to view additional actions
Edit– You can use this to edit details of your switchDelete– Use this action button to delete a switch from UnityOneAlert Notification:This action button will help you enable alert notifications for a particular user.
A firewall is a hardware or software device that monitors and controls the flow of entering and exiting traffic of a network server.
How to add a Firewall
If you navigate your cursor to the top-right hand side of the page, you will be able to view the button ‘Add Firewall.’ Click on it and enter the details mentioned below
Name– In this field you have to enter a name for your firewallPrivate Cloud– In this field you have to select a Private Cloud from the drop-down to link your firewallSelect Manufacturer- In this field you have to select a manufacturer from the drop-downModel- You have to select a model from the drop-down hereManagement IP– In this section you have to enter a device IP address for console accessCabinet– In this field you have to select a cabinet from the drop-downPosition– In this field you have to enter the position of device in the cabinetSize– Enter the size of the device hereAsset tag– You have to enter a tag if it existsEnter a new tag– You have to enter a name here to create a new tag
Click on ‘Submit’ to successfully add your firewall to UnityOne.
Note If you get an error after clicking submit, please ensure again that all the provided information is correct and if the issue still persists, contact the UnityOne support team.
We support firewall manufacturers like Cisco Juniper, Paloalto, Fortinet, Checkpoint, Sonicwall, Watchguard, Netgear, etc.
In this tab, you will find details about the name of the firewall, a status indicator (running status of the Firewall: Red indicates down, Green indicates up), the model of the firewall, the type of firewall, and the management IP and tags.
Some of the additional action buttons are mentioned below:
Action Buttons
Manage in same tab– This action button will assist you to manage the devices via SSH in the same tab (as a floating terminal)Manage in new tab- This action button will help you manage the devices via SSH in two ways. The first one is via web access which redirects to the web portal for management. The other is via console access which redirects you to the command terminal for device management. (If your web access is not configured, you can request web access from UnityOne support by clicking on the ‘Request web access’ button).Configure monitoring– This action button will assist you to get advance monitoring data of firewallsManage by creating a support ticket– From this action button you can manage your firewalls by raising a ticket with the support team.
A load balancer is a network device that is used to distribute traffic across multiple servers in a data center. It improves the application's performance and reliability.
How to add a load balancer
If you navigate your cursor to the top right-hand side of the page, you will be able to view the button ‘Add Load Balancer.’ Click on it and enter the details mentioned below:
Name –In this field you have to enter a name for your load balancerPrivate Cloud– In this field you have to select a Private Cloud from the drop-down to link your switchSelect Manufacturer- In this field you have to select a manufacturer from the drop-downModel- You have to select a model from the drop-down hereManagement IP– In this section you have to enter a device IP address for console accessCabinet– In this field you have to select a cabinet from the drop-downPosition– In this field you have to enter the position of device in the cabinetSize– Enter the size of the device hereAsset tag– You have to enter a tag if it existsEnter a new tag– You have to enter a name here to create a new tag
Click on ‘Submit’ to successfully add your Load balancer to UnityOne.
Note If you get an error after clicking submit, please ensure again that all the provided information is correct and if the issue still persists, contact the UnityOne support team.
We support various load balancers manufactured by F5, Citrix (NetScaler), and others.
In this tab, you will find details about the name of the load balancer, a status indicator, the model of the load balancer, the type of load balancer, and the management IP.
Some of the additional action buttons are mentioned below:
Action Buttons
Manage in same tab– This action button will assist you to manage the devices via SSH in the same tab (as a floating terminal)Manage in new tab- This action button will help you manage the devices via SSH in two ways. The first one is via web access which redirects to the web portal for management. The other is via console access which redirects you to the command terminal for device management. (If your web access is not configured, you can request web access from UnityOne support by clicking on the ‘Request web access’ button).Configure monitoring– This action button will assist you to get advance monitoring data of load balancersManage by creating a support ticket– From this action button you can manage your load balancers by raising a ticket with the support team.
Click on the three dots icon (...) to view more actions buttons:
Edit– Here you can edit the details of your load balancerDelete– Use this action button to delete a load balancer from UnityOneAlert Notification: This action button will help you enable alert notifications for a particular user.
A bare metal server is a physical computer server one consumer or tenant uses. The operating system is directly installed on a bare metal server to deliver better performance.
How to add a bare metal
If you navigate your cursor to the top right-hand side of the page, you will be able to view the button ‘Add Bare Metal.’ Click on it and enter the details mentioned below:
Name– In this field you have to enter a name for your Bare metalPrivate Cloud– In this field you have to select a Private Cloud from the drop-down to link your bare metalSelect Manufacturer- In this field you have to select a manufacturer from the drop-downModel- You have to select a model from the drop-down hereManagement IP– In this section you have to enter a device IP address for console accessCabinet– In this field you have to select a cabinet from the drop-downPosition– In this field you have to enter the position of device in the cabinetSize– Enter the size of the device hereAsset tag– You have to enter a tag if it existsEnter a new tag– You have to enter a name here to create a new tag
Click on ‘Submit’ to successfully add your Bare Metal to UnityOne.
Note If you get an error after clicking submit, please ensure again that all the provided information is correct and if the issue still persists, contact the UnityOne support team.
We support various manufacturers of bare metals like HP, IBM, Dell, SuperMicro, etc.
In this tab, you will find details about the name of the bare metal, a status indicator, the model of the bare metal, the type of bare metal, and management IP.
Some of the additional action buttons are mentioned below:
Action Buttons
Stop Server– This action button will help you to switch off your serverManage in the same tab– This action button will assist you to manage the devices via SSH in the same tab (as a floating terminal)Manage in new tab- This action button will help you manage the devices via SSH in two ways. The first one is via web access which redirects to the web portal for management. The other is via console access which redirects you to the command terminal for device management. (If your web access is not configured, you can request web access from UnityOne support by clicking on the ‘Request web access’ button).Configure monitoring– This action button will assist you in getting advance monitoring data of bare metals.Manage by creating a support ticket– From this action button you can manage your bare metals by raising a ticket with the support team.
Mac mini servers host infrastructure in a managed data center on Mac OS to build and test your applications on MAC OS and iOS systems.
How to add Mac mini Server
If you navigate your cursor to the top right-hand side of the page, you will be able to view the button ‘Add Mac mini.’ Click on it and enter the details mentioned below:
Required Details :
Name– In this field you have to enter a name for your Mac mini deviceSerial Number– In this field you have to enter serial number provided for your mac miniOS– In this section you have to select an Operating system from the drop-downSelect Manufacturer- You have to select a manufacturer from the drop-downModel- In this field you have to select a model from the drop-downNumber of CPU’s- In this field you have to enter the number of CPUs attached to your miniNumber of Cores– In this field you have to enter the number of coresMemory– In this field you have to enter the memory of the server (MB)Capacity– In this field you have to enter the capacity of the server (GB)Management IP– In this section you have to enter a device IP address for console accessPrivate Cloud– In this field you have to select the associated Private Cloud from the drop-downCabinet– In this field you have to select a cabinet from the drop-downAsset tag– You have to enter a tag if it existsEnter a new tag– You have to enter a name here to create a new tag
Click on ‘Submit’ to successfully add your Mac mini to UnityOne.
NoteIf you get an error after clicking submit, please ensure again that all the provided information is correct and if the issue still persists, contact the UnityOne support team.
If you want to enable monitoring, then tick the box to activate monitoring.
In this tab, you will find information about your device name, status, serial number, operating system, associated cloud, management IP, tags, and some additional action buttons.
Action Buttons
Recycle PDU – Use this action button to recycle PDU Manage in the new tab - This action button will help you manage the devices via SSH in two ways. The first one is via web access which redirects to the web portal for management. The other is via console access which redirects you to the command terminal for device management. (If your web access is not configured, you can request web access from UnityOne support by clicking on the ‘Request web access’ button). Mac mini statistics – This action button will assist you to get advance monitoring data of Mac mini. Manage by creating a support ticket – From this action button you can manage your Mac mini by raising a ticket with the support team.
Recycle PDU– Use this action button to recycle PDUManage in the new tab- This action button will help you manage the devices via SSH in two ways. The first one is via web access which redirects to the web portal for management. The other is via console access which redirects you to the command terminal for device management. (If your web access is not configured, you can request web access from UnityOne support by clicking on the ‘Request web access’ button).Mac mini statistics– This action button will assist you to get advance monitoring data of Mac mini.Manage by creating a support ticket– From this action button you can manage your Mac mini by raising a ticket with the support team.
Click on the three dots icon (...) to view more actions buttons
Device info– Here you can view the device infoEdit– Use this action button to edit details of your Mac miniDelete– This action button will help you delete a Mac mini from UnityOne
A virtual machine is a software computing resource that offers a virtual environment instead of a physical one to run, operate, and deploy apps and programs.
This tab will have details about all the VMs added to UnityOne. You can find details such as the name of the VM, status, OS name, cloud type, and attached cloud name.
As a default view, you can view all your VMs inside the all VM tab; also, you can also click on individual tabs to view VMs inside the Private Clouds & public clouds attached.
A container is a standard software unit that packages up code, all its dependencies, and libraries to keep applications reliable and run quickly. You can manage your Istio, Kubernetes, and docker swarm containers.
On this page, you can find two different tabs from the top grid: one for nodes and the other for pods.
A node is the smallest element of computing hardware in the Kubernetes system. In general, it represents a single machine in a cluster.
From this tab, you can view information about your containers, such as name, status (running status of the nodes; red indicates down, green indicates up), operating system, internal IP, external IP, CPU requests, CPU Limits, memory requests, and memory limits. To manage these nodes, you can use this action buttons mentioned below:
Action Buttons
Open in the same tab– Use this action button to open an SSH console for managing nodes in the same tabOpen in new tab– Use this action button to open an SSH console for managing nodes in a new tab
Pods contain one or more containers, the most basic deployable objects in the Kubernetes system.
From the pod's tab, you can view information related to your pods, such as name, status, namespace, pod IP, host IP, Cloud, cloud name, and start time, and also you can perform a couple of management actions via action buttons.
Action Buttons
Show containers– Here you have to list your containers inside the pod (you will get details of your containers)Delete– Use this action button to delete a pod
A storage device is a physical device that enables data storage and applications hosted in a data center.
You can view storage details from the storage tab, like the name of the storage device, status, associated cloud, OS, management IP, storage and tags (graphically represent available capacity and used capacity).
How to add Storage
Once you click the “Add” button you will be prompted to enter the following details:
Name:In this field, you must provide the name of the storage device.Management IP:Here, you need to provide the IP address of the storage device for management.Manufacturer:You have to select the manufacturer from the drop-down list available here.Model:In this field, you have to select the model from the drop-down list available here.Data Center:You can select the data center in which the storage devices are hosted.Private Cloud:Select the Private Cloud from the available drop-down.Cabinet:Choose the cabinet from the data center you selected earlier.Position:You can enter the position of the device, inside the cabinet from this field.Size:Here, you can enter the size of your device.Asset Tag:If you have already created an Asset Tag, you enter the same from here.Enter a new Tag:This option can be used to create a new Tag.
Click on the "Submit" button to successfully add your device to the platform.
Note If you get an error after clicking submit, please ensure again that all the provided information is correct and if the issue still persists, contact the UnityOne support team.
You can manage your storage device remotely with the help of the following action buttons.
Action Button Functionality
Manage in same tab– This action button will assist you to manage the devices via SSH in the same tab (as a floating terminal)Manage in new tab- This action button will help you manage the devices via SSH in two ways. The first one is via web access which redirects to the web portal for management. The other is via console access which redirects you to the command terminal for device management. (If your web access is not configured, you can request web access from UnityOne support by clicking on the ‘Request web access’ button).Storage statistics– Use this action button to get advanced monitoring statistics of storageManage by creating a support ticket– From this action button you can manage your storage by raising a ticket with the support team.Edit– Use this action button to edit details of your storage deviceDelete– This action button will help you delete your storage device from UnityOneAlert Notification:This action button will help you enable alert notifications for a particular user.
S3 is a virtual storing technology built to store and recover any amount of information over the internet.
How to add an S3 account
Click on the ‘Add account’ button from the top right-hand side corner, fill in the mandatory information.
Mandatory Information:
Account Name:You have to enter the name of AWS accountAccess Key:You have to enter your access key details provided by AWSSecret Key:Enter the secret key details shared by AWSEndpoint URL:You have to enter the URL of your S3 account.Private Cloud:Select the associated Private Cloud from the available drop-down.
Click ‘Submit’ to add an S3 account to UnityOne.
NoteIf you get an error after clicking submit, please ensure again that all the provided information is correct and if the issue still persists, contact the UnityOne support team.
Action Buttons
Show buckets– Use this action button to view buckets present in the S3 accountChange API Keys– This action button will help you to change your API keysEdit– You can use this action button to edit your S3 account detailsManage by creating a support ticket– From this action button you can manage your S3 account by raising a ticket with the support team.Delete account– You can use this action button to delete your S3 account from UnityOne.
You can view the list and manage your Private Clouds from this tab. We have included details like cloud names, virtualization platforms, and hypervisors.
Action Button Functionality
Manage in new tab– Use this action button to manage cloud controllers from a new tab (opens a login page)Manage by creating a support ticket– From this action button you can manage your cloud controllers by raising a ticket with the support team.
You can maintain the inventory of your mobile devices from this page. Additionally, you can download and add mobile devices for tracking purposes.
NoteWe don't track or monitor your mobile devices.
You can find information about your mobile devices, such as name, serial number, device type, platform, model, IP address, and tagged devices.
How to add a mobile device
From the top of the page, click on the ‘Add mobile’ device button and a new pop-up window will open. Fill in the required details mentioned below:
Name:In this field, you have to add the name of your mobile device.Model:In this field, you have to enter the model of your mobile device.Serial number:In this field, you have to enter the serial number of your mobile device.IP address:In this field, you have to enter the IP address of your device for console access.Select platform:In this field, you have to select your OS (Android or iOS).Device type:In this field, you have to select your device type (smartphone or tablet).Data center:In this field, you have to select the data center from the drop-down.Tagged device:In this field, you have to tag your device by entering the existing tags.Enter a new tag:In this field, you can add a new tag to your device.
Click on ‘Submit’ to add your mobile device successfully.
NoteIf you get an error after clicking submit, please ensure again that all the provided information is correct and if the issue still persists, contact the UnityOne support team.
Action Button Functionality
Edit– This action button will help you to edit the details of your mobile deviceDelete– Use this action button to delete your mobile device data from UnityOneManage by creating a support ticket– From this action button you can manage your mobile devices by raising a ticket with the support team.
A database is an organized collection of data in rows and columns typically stored in an electronic computer (server) from which users can access and manage periodically.
UnityOne also provides users with a feature to manage their databases. It supports MySQL, SQL, PostgreSQL, and Oracle. This page includes information about your databases, such as instance name, status, type, port, server name, management IP, operating system, tags and cloud details, and also gives you a few action buttons to manage your databases.
How to add a Database to UnityOne
From the top of the page, click on ‘Add mobile database’ button, a new pop-up window will open. You have to fill in details mentioned below:
Select server type:In this field you have to select the server on which your database is hosted (VM or Bare Metal). Suppose your server type is bare metal; select the server from the drop-down. If your server type is Virtual Machine, select the Private Cloud and VM from the respective drop-downs.Database instance name:In this field you have to enter the name of database instance.Select database type:In this field you have to select your database type (MySQL, MS SQL server, Oracle, PostGRESQL) from the drop-down.Assign a port number:In this field, you have to enter the port number.Enter a new tag:In this field you have to, you can add a new tag to your database.
Click on ‘Submit’ to successfully add your Database to UnityOne.
Note If you get an error after clicking submit, please ensure again that all the provided information is correct and if the issue still persists, contact the UnityOne support team.
Action Button Functionality
Manage in same tab– This action button will assist you to manage the devices via SSH in the same tab (as a floating terminal)Manage in new tab– This action button will help you manage the devices via SSH in the new tabStorage statistics– This action button will assist you in getting advance monitoring data of databases.Manage by creating a support ticket– From this action button you can manage your databases by raising a ticket with the support team.
Click on the three dots icon (...) to view more actions
Edit– Use this action button to edit the details of your DatabasesDelete– This action button will help you delete a database from UnityOneAlert Notification:This action button will help you enable alert notifications for a particular user.
In this tab, you will find information about your devices if you have any other devices.
Services
Navigate to UnityCloud > Services
With UnityOne’s UI console, you can manage all your mesh management activities and their applications.
A mesh manager helps you configure multiple events decoupled among applications, cloud services, and devices into an event mesh.
How to add a mesh service
From the mesh managers page, you can manage three different mesh managers of public clouds: Istio, GCP, Anthos service, and AWS App mesh. You can add a mesh managing account to UnityOne by clicking on the ‘Add’ button from the top. Once you click on ‘Add’, you will be prompted to fill in the following details:
Mesh service type:In this field you have to select the type of mesh serviceFill account name:In this field you have to enter the name of your service account.Email:In this field you have to enter the associated email.Service info:In this field you have to enter the service information of your respective mesh type.
Finally, click on ‘Add’ to add your mesh service account to UnityOne successfully.
Anthos service mesh is a fully managed mesh service from GCP that helps manage your mesh services across on-premises or the GCP cloud.
Use the available action buttons to manage your GCP mesh manager:
Action Button
Anthos Traffic director– Use this action button to view and manage different events under GCP mesh services.Edit– This action button will help you to edit your GCP mesh service account detailsChange service account info– This action button will assist you to modify or update details of your GCP mesh service account infoDelete– Use this action button to delete your GCP Anthos service mesh accountManage by creating a service support ticket– From this action button you can manage your GCP mesh manager by raising a ticket with the support team.
Once you click the ‘Anthos traffic director’ action button, it will display all the events coupled into your GCP mesh. You will find details such as the name of the event, VPC network details, NEG count, regions, and routing rule maps.
Additional Action Buttons within ‘Anthos traffic director’:
Network endpoints:This action button will help you in viewing the network endpoints groups.View service tree:This action button will assist you to view the service tree.Manage by creating a service ticket:You can use this action button to manage your GCP mesh service with the help of the UnityOne support team.
Istio is an open-sourced service for mesh management of applications, and it was initially developed jointly by IBM, Google, and Lyft.
To manage your Istio mesh manager, you will get a few action buttons mentioned below:
Action Button Functionality
Istio –You can use this action button to view and manage different events under Istio mesh servicesEdit –This action button will help you to edit your Istio mesh service account detailsChange service account info– Use this action button to modify or update the details of your Istio mesh service account infoDelete– You can use this action button to delete your Istio service mesh accountManage by creating a service support ticket– From this action button you can manage your Istio Mesh Manager by raising a ticket with the support team.
Once you click on the ‘Istio’ action button, you can view the name, status, namespace, gateways, and destination host.
Additional Action Buttons
Network endpoints:This action button will give you access to network endpoint groups from where you can manage and edit your network devices configurations.View service tree:This action button will fetch the details of your network tree.Manage by creating a service request ticket:This action button will help you to manage your AWS mesh service with the help of the UnityOne support team.
AWS app mesh is a service mesh manager for the AWS cloud that is offered under their stack of services, and it makes it easy to communicate various microservices running on the AWS ecosystem.
Action Button Functionality
AWS App Mesh– This action button will assist you to view and manage different microservices under AWS mesh services.Edit– You can use action button to edit your AWS mesh service account detailsChange service account info– This action button will assist you to modify or update details of your AWS mesh service account infoDelete– You can use this action button to delete your AWS app mesh service mesh accountManage by creating a service support ticket– From this action button you can manage your AWS service mesh manager by raising a ticket with the support team.
Once you click on ‘AWS App Mesh’, it will display the name, status, virtual nodes, virtual routers, and virtual services.
Additional Action Buttons
App Details:This action button will give you access to the details of backend virtual nodes through which you can manage and edit the routesView service tree:This action button will fetch the details of your network tree.Manage by creating a request ticket:This action button will help you to manage your AWS mesh service with the help of the UnityOne support team.
UnityConnect
We offer an advanced interconnection solution called UnitedConnect. You can integrate UnitedConnect with any on-premise environment with a private or public cloud (AWS, Azure, GCP, OCI). Through this, you can connect to the cloud of your choice. It also helps you reduce network costs, increase bandwidth throughput, and provide reliable, consistent network connectivity.
UnityConnect is a service offered to UnitedLayer customers who are using our solutions to manage their network connection, view their real-time bandwidth billing details, and give them a choice to buy a new connection with the help of our team.
Why UnitedConnect
Combines on-premises, private cloud, and public cloud to create an optimal environmentConnect your environment securely using an encrypted VPN tunnel or completely bypass the internetCuts down your network costsWorkload management across multiple platforms for on-demand needs
Navigate to UnityCloud > UnityConnect
You can click on it to view and manage your UnityConnect services.
On this page, you can find three different tabs:
Network ConnectionBandwidth BillingBuy Connection
You can navigate into those tabs by simply clicking on them.
How to add a port
To add a network port, click on ‘Add Port’ from the top right hand side then fill the details mentioned below:
Select the device type:You have to select a device from the available drop-down.Device:You have to select the device from the drop-down for the above selected device type.Port name:In this field, you have to enter a user-friendly name.Port:Here you have to select the port from the available drop-down.
Click on ‘Submit’ to add your Port successfully.
Note If you get an error after clicking submit, please ensure again that all the provided information is correct and if the issue still persists, contact the UnityOne support team.
From this page, you can view the details of your ports, such as name, port, traffic analysis, speed, and Mac address.
Action Buttons
Delete:You can use this action button to delete a port.
On this page, you will find information about your network bandwidth usage and billing information.
How to add a bill
To add a bill, click on the ‘Add Bill’ button from the top right hand side then fill the details mentioned below:
Bill name:In this field you have to enter a user-friendly name.Ports:Here you have to select the port from the available drop-down.Bill Type:In this field you have to select two types of billings such as 95th percentile and transfer quotaAllowed Usage:In this field you have to enter the numerical value of allowed bandwidth usage (You can also select the units of bandwidth usage such as bps, Kbps, Mbps, Gbps, and Tbps).Cost/MB:In this field you have to enter the cost associated with a single MB.Description:In this field you have to add a short description in the field.
Click on ‘Submit’ to add your bill details successfully.
Note If you get an error after clicking submit, please ensure again that all the provided information is correct and if the issue still persists, contact the UnityOne support team.
This page will have information about your bill name, type, allowed and used bandwidth, over- usage details with a utilization chart, and estimated cost (actual cost may vary).
Action Buttons:
Edit:This action button will help you to edit the added billing details.Delete:This action button will help you to delete the added billing details.Accordion:When you click on this action button, it will show you the information about your associated bandwidth details, where you can view the allowed and used bandwidth, inbound and outbound speed, and other necessary parameters from the same widget graphically.
This tab will help you in buying a new connection from UnityOne.
How to buy a connection
Click on the ‘Buy Button’ that is available on the top right-hand side corner and then fill the details mentioned below:
Select your connection type:You have to select your connection type (AWS direct connect, Azure, express route, Google cloud dedicated to connecting, etc.) from the drop-down.Description:Here you have to provide a description of your requirements.
Once you click on the ‘Buy’ button, and a new ticket will be created with the UnityOne support team, and we will help you buy and establish a new connection for you.
From this page, you can also view your information related to connection details, such as requester email ID, connection type, ticket ID, and ticket status.
Action Buttons:
Delete:This action button will help you to delete a ticket.
UnityServices
In this module, you can find various service options offered by UnityOne to manage your day-to-day cloud operations. On this page, you will find three different tabs to manage multiple services such as DevOps-as-service, service catalog, AI/ML event management and sustainability operations.
Navigate to Unity Menu > UnityServices to view and manage your services offered by UnityOne.
DevOps-as-a-service
In this section, you can enroll your DevOps controllers, such as Ansible, Chef, puppet, terraform. In UnityOne. You can view, manage, and monitor your day-to-day operations effortlessly or bring your scripting for DevOps automation using a CLI terminal.
How to add a DevOps Controller
Click on the ‘Add server’ button from the top right-hand side and enter the details mentioned below:
Name:Enter your preferred name of the serverSelect platform type:Choose a type of platform from the drop-down (Linux or Windows).OS:Enter the operating system of your server.IP Address:In this field you have to IP address for the management of the server.Port Number:In this field you have to enter the associated port number.
Click on ‘Submit’ to successfully add your DevOps controller to UnityOne.
Note If you get an error after clicking submit, please ensure again that all the provided information is correct and if the issue still persists, contact the UnityOne support team.
Action Button
Edit– This action button will help you can edit the details of your server.Delete– This action button will assist you to delete your server.Open in the same tab– This action button will assist you to open the SSH terminal in the same tab.Open in new tab– This action button will help you to open the SSH terminal in the new tabManage by creating a new ticket– You can use this action button to get help from our support team to manage your service.
Service Catalog
In a unified view of service deliverables, the service catalog page will provide a detailed view of the services requested from UnitedLayer or other service providers.
In this tab, you can find information about the service category, provider info, service name, charge.
Action Button
Manage by creating a new ticket– You can use this action button to get help from our support team to manage your service.
Note 1You can click on the drop-downbeside the service category section to filter the service categories view.
Note 2 Similarly, you can click on the accordion beside the provider section to filter the provider view.
Note 3After selecting your filter choice as recommended from notes 1 & 2, you have to click on the ‘Refresh’ icon on the top right-hand corner of the page to view your results.
Sustainability
The sustainability module will help you monitor, measure, and analyze the carbon emission levels of your global carbon footprints deployed across distributed systems such as Private Clouds, public clouds, data centers, and enterprise IT.
On this page, you can find three different tabs, such as dashboard, graphs and insights, emission details, and usage, to view and monitor the carbon emissions of your IT ecosystem.
Adding GCP Accounts
Access Google Cloud Tab:Click on "Unity Cloud" and navigate to the "Public Cloud" section. Select the "Google Cloud" tab.List GCP Accounts:Under the Google Cloud tab, you'll find a list of GCP accounts associated with your Unity Cloud organization.Adding an Account:To add a new GCP account, click on the "Add Account" button. A modal will appear.Fill Account Details:In the modal, provide the account name, service information, and email associated with the GCP account.Click Add:Once you've filled in the details, click the "Add" button. The GCP account will be added to your Google Cloud integration and displayed in the table below.Table Columns:The table displays various columns, including account name, email, project ID, regions, and actions.
Export the GCP carbon footprint to Unity:
To export your carbon footprint data via the BigQuery for data analysis or custom dashboard and report creation, follow these steps below:
- Login in to the GCP management console
- Create a project with the name of your choice
- Export the carbon footprint data using BigQuery
The visual representation of the carbon footprint information will be visible when you click on:
Navigation Menu > Carbon Footprint
To export the carbon footprint data, simply click on "Export," which will prompt a new page to open.
Configuring a Carbon Footprint export to BigQuery:
Carbon footprint data is exported via the BigQuery Data Transfer Service.
The data transfer establishes a monthly partitioned table named "carbon footprint" within the BigQuery dataset of your selection.
Note: Carbon Footprint data is exported on the 15th day of each subsequent month. For example, carbon data for September 2022 will be exported on October 15, 2022.
Once a Carbon Footprint transfer configuration is set up, it will automatically export future carbon reports on the 15th day of each month.
Follow the steps below to initiate the export:
- Go to Carbon Footprint tab
- Select the Cloud Billing account you want to export from the Billing account menu.
- Click on Export to enable the BigQuery Data Transfer Service and open the BigQuery Data Transfer Service page.
On the BigQuery Data Transfer Service page:
- Source should be set to "Google Cloud Carbon Footprint Exports".
- Enter a “Display Name” in the Transfer configuration.
- In Destination settings, click the Dataset ID field and then select Create new dataset if you want to create a new BigQuery dataset to host the exported table; alternatively select an existing BigQuery dataset.
- In Data source details, confirm the Cloud Billing account ID to export. You can also add additional account IDs as a comma separated list. All billing account IDs should be in the format XXXXXX-XXXXXX-XXXXXX.
Click on “Save” to confirm and save all the relevant details.
Finally click on “Allow” in the access request window for setting up the transfer configuration.
Note: The transfer config does not automatically export historical data. To request historical data back to January 2021, schedule a data backfill.
Follow the steps below to schedule the data backfill:
- Navigate to the details of the transfer you have just created.
- Click on “Schedule Backfill”
- Choose the “Run for a date range” option
- Set the start date as February 15, 2021, and the end date as today's date.
Note: The exported data for February 15, 2021, contains the January 2021 data and is therefore the earliest month available to request.
Finally, click on “Okay” to request the data backfill.
Data backfills will be created for the selected range, exporting historical monthly data to the destination dataset.
Once the data is exported, you can use BigQuery to view and query the data.
Note: You can share the exported data to others in your organization by granting them the BigQuery User IAM role on the project selected earlier. Alternatively, you can grant fine-grained access at the dataset or table level using the BigQuery Data Viewer IAM role.
In addition to the steps mentioned above, you need to enable the Cloud Billing API. You can do this by searching for it directly within the GCP management console.
Note: If it is already enabled, then skip this step.
Enabling Sustainability:
Select Region: To enable sustainability, first, choose a region from the list provided in the table.Initiate Sustainability: Click on the leaf symbol in the "Actions" column corresponding to the chosen region. This will open a modal.Fill Model Details: In the model, fill in the account name, select the billing account from the dropdown, and choose a dataset from the dropdown options.Submit: After completing the required fields, click "Submit." This action will enable sustainability for the chosen account in the specified region. View Sustainability Info: You can now view the sustainability information in the "Sustainability" tab under Unity Services. Dashboard
In the dashboard view, you may graphically observe multiple grids, which include charts and graphs that give insights into various carbon emission metrics and levels. In the first grid, you can find information about your total carbon emission per annum, total power usage, data center with the highest carbon emission, and device type with the highest carbon emission.
In the second grid, you will find different charts that give CO2 emission insights on ‘emissions by top 10 tag groups’, ‘emissions by data center,’ ‘emissions by device type,’ ‘emissions by Private Cloud,’ ‘emissions by public cloud,’ ‘emissions by a quarter,’ and ‘emissions by year.’
Graphs and Insights:
Emission by Datacenter:This graph illustrates the carbon emissions of all data centers in your organization in a bar plot.Emission by Device Type:This graph showcases carbon emissions categorized by different device types in your organization in a bar plot.Emission by Private Cloud:Understand carbon emissions related to private cloud usage within your organization.Emission by Quarter:Analyze carbon emissions quarterly, helping you track changes and improvements over time.Yearly Emission:This graph provides an annual perspective on carbon emissions.Emission by Top 10 Tag Groups:Devices in Unity are tagged, and this graph displays carbon emissions by the top 10 tag groups with the highest emissions in your organization.
Emission Details
In this tab, you are provided with options to select data centers, select cabinets, and select device types to find out carbon emission details based on your preferences.
- Filter Options: On this page, you'll find filter options under "Emission by":
- Datacenter
- Public Cloud
- Datacenter Filter: If you select "Datacenter," you can choose to filter by:
- All Datacenters or specific ones
- Cabinets
- Device Types
- Public Cloud Filter: If you select "Public Cloud," you can filter by:
- Cloud Name
- Subscription
- Graph Insights: Based on your filter selections, you'll receive insights in the form of graphs.
Usage
Here you can apply different kinds of filters to break down the usage insights, where you can view the results based on factors of data centers, cabinets, and device types. You can check or uncheck your choices by clicking on the respective drop-downs. Also, you can further narrow down your results using the duration filter for time stamps.
Usage tab displays various information of devices within organization.
- Filter Options: In this tab, you can filter data using the following parameters
- Datacenter
- Cabinets
- Device Types
- Duration
- Customize Table Columns: Below the filters, you'll find a table with columns:
- Subscription
- Device Name
- DC name
- Region
- Cabinet
- Type
- Power Usage (kilowatt-hour)
- CO2 Emission (TCO2e)
- Uptime
- IP address
- Model
- Tags
- Column Dropdown: You can customize the displayed columns by using the dropdown in the right corner of the table. Choose the columns you want to view.
AIML Event Management
The below process describes different types of alerts for various devices captured by UnityOne and applying custom rules to filter those alerts based on your preferences.
Accessing Unity Services and AIML Event Management
To begin managing your alerts, follow these steps:
- Click on Unity services from the main menu.
- From the dropdown menu, select AIML Event Management.
- You will be directed to the AIML Event Management page.
Summary Page
The Summary page provides an overview of the active alerts/events and allows you to filter them using custom rules. Here are some key points to note about the Summary page:
- By default, the page opens in the Event Reduction tab, displaying the summary of active alerts/events.
- The alerts/events shown on this page are only the open/active ones. Closed and resolved events are not displayed.
- On the Summary page, you will find clickable tabs for events, alerts, conditions, and analytics. Clicking on each tab will take you to the respective section with detailed information.
Below the tabs, you will see boxes that provide the count of devices in different categories that have active events/alerts. These categories include compute, network, storage, and others. This gives you an overview of the distribution of active events/alerts across different device types.
Overall Summary Graph: In the upper right corner, there is an overall summary graph. This graph provides information such as the total number of active events, alerts noise reduction percentage, and conditions correlation percentage. It offers a visual representation of the overall summary of the active events/alerts and their reduction through rules and correlations.Noisy Events Table:The Noisy Events Table contains a list of devices for which the maximum number of alerts/events are generated and remain active/open. The table provides details such as Device Name, Device Type, Count, Description of alerts/events, Source, and the time when these alerts were generated. Additionally, the severity of the alerts is also mentioned.Noisy Host: The Noisy Host section represents the devices with the highest number of events in the form of a bar graph. This visual representation helps identify the devices that generate a significant number of alerts/events.Events Trend - Device Type: The Events Trend graph displays trends based on various parameters. In the right corner, you will find a dropdown menu that allows you to select values such as device type, event source, data center, cloud, and severity. Based on your selection, the graph presents a pie chart showing the distribution of events according to the selected parameter.- In the upper right corner, you will find the settings button (rule setting button), which redirects you to the Suppression Rule page by default.
Events Page
The Events page displays a list of events that are generated when devices experience issues such as downtime or warnings. The events are presented in a table format, including the following details:
ID:The unique identifier for each event.Device Name:The name of the device associated with the event.Device Type:The type of device generating the event (e.g., router, server, switch).Management IP:The management IP address of the device.Description of Alerts:A brief description of the event or alert.Alert Time:The time when the event was triggered.Severity:The severity level of the event (e.g., critical, warning, information).Status:The current status of the event (e.g., open, active).Acknowledged:Indicates whether the event has been acknowledged or not.Source:The source of the event (e.g., monitoring tool, device).Duration:The duration of the event since it was triggered.Recovery Time:The time when the event was resolved or recovered.Actions:Any recommended actions or steps to be taken for the event.
Note The table displays open/active events. Resolved events will remain visible for 10 minutes before automatically disappearing from the table.
Alerts Page
The Alerts page handles events that are similar and occur within a timeframe of 5 minutes. These events are deduplicated, meaning they are combined into a single alert to avoid duplication. This process of combining similar events is known as "deduped events." After deduplication, the events go through suppression rules that are defined to filter out less important or noisy alerts. This reduction of events to alerts is calculated as the "Noise Reduction Percentage."
Conditions Page
Following the deduplication and suppression process within the 5-minute timeframe, the resulting alerts are subject to correlation rules defined in the system. If an alert satisfies a correlation rule, it will create a condition. These conditions are used to group related alerts and further reduce the number of alerts. The reduction of alerts into conditions is calculated as the "Correlation Percentage."
The use of correlation rules helps streamline and organize the alerts, providing a more structured and manageable view of the events and their impact.
Rule Settings
The Rule Settings section allows you to create suppression rules and Correlation Rules.
The Rule Settings section allows you to create suppression rules with multiple conditions to ignore specific alerts or events that you think unimportant.
Follow these steps to create a suppression rule:
- Select the Suppression Rule tab from the Rule Settings page.
- Click on the "Add Rule" button located in the upper right corner. This will open a modal box with several input fields.
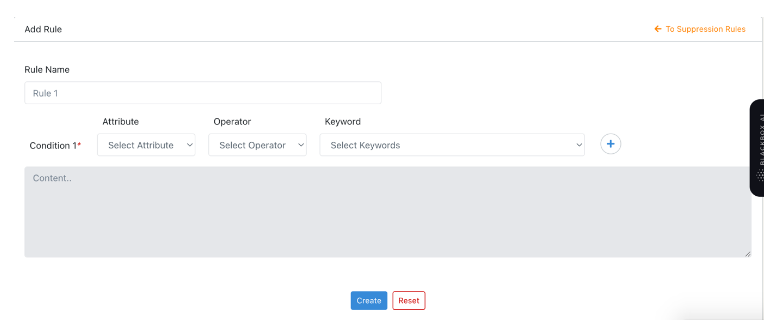
Suppression Rule Inputs
Rule Name:Provide a name for the rule you are creating in the Rule Name input box.Condition 1:This condition consists of multiple dropdowns: Attribute, Operator, and Keyword.Attribute:Choose an attribute from the dropdown list, such as name, description, source, severity, or category.Operator:When you click on the Operator dropdown, you will see options like "is," "in," and "contains.""is":This operator signifies that the attribute must exactly match the keyword."in":Selecting this operator means any value of the keyword will be considered."contains":Choosing this operator allows any string value you enter in the keyword field to match.
Keyword:The options in this dropdown depend on the selections made in the Attribute and Operator dropdowns. Choose the appropriate keyword based on your requirement.
Adding Multiple Conditions
- Click the "+" button to add additional conditions. You can create multiple conditions based on your needs.
- After clicking the "+" button, you will see an additional dropdown for "AND" or "OR." Choose "AND" if all conditions must be satisfied, or choose "OR" if any condition can be satisfied.
- For example, if you want to create a rule that ignores alerts with severity labeled as "information," your first condition would be:
Condition 1:
Attribute:SeverityOperator:isKeyword:Information
- For example, to add another condition, let's say you want to suppress events with the description "No SNMP data collection." In this case, you would create the following condition:
Condition 2:
Attribute:DescriptionOperator:containsKeyword:No SNMP data collection
- Choose "AND" or "OR" based on your requirements.
Correlation rules are used to create conditions or correlations for suppressed alerts/events. If all the alerts within a timeframe, such as 5 minutes, satisfy any correlation rule, they will be grouped together and create a condition based on the name of the correlation rule you have created.
On the other hand, any alert that doesn't satisfy any correlation rule will create an unclassified condition.
When a condition is created, it automatically generates a support ticket for further action or investigation.
Follow these steps to create a suppression rule:
- Select the Correlation Rule tab from the Rule Settings page.
- Click on the "Add Rule" button located in the upper right corner. This will open a modal box with several input fields.
Correlation Rule Inputs
Rule Name:Provide a name for the rule you are creating in the Rule Name input box.Condition 1:This condition consists of multiple dropdowns: Attribute, Operator, and Keyword.Attribute:Clicking on the Attribute dropdown will display options such as Event Source, Event Type, Event Severity, Event Category, Event Description, Device Type, Device Name, and Device Tag.Operator:When you click on the Operator dropdown, you will see options like "is," "in," and "contains."-
"is":This operator signifies that the attribute must exactly match the keyword. "in":Selecting this operator means any value of the keyword will be considered."contains":Choosing this operator allows any string value you enter in the keyword field to match.Keyword:The options in this dropdown depend on the selections made in the Attribute and Operator dropdowns. Choose the appropriate keyword based on your requirement.
Adding Multiple Conditions
To add additional conditions, click the "+" button. This button allows you to create multiple conditions based on your requirements.
After clicking the "+" button, you will see an additional dropdown for "AND" or "OR." Choose "AND" if all conditions must be satisfied, or choose "OR" if any condition can be satisfied.
For example, let's say you want to create a rule that creates a condition for alerts with descriptions containing the phrase "link is down." You would set the following condition:
Condition 1:
Attribute: Event Description
Operator: contains
Keyword: link is down
To add another condition, such as checking if the device is a Firewall, you would create the following condition:
Condition 2:
Attribute: Device Type
Operator: is
Keyword: Firewall
Choose "AND" or "OR" based on your requirements.
Analytics Page
The Analytics page provides valuable insights into the alerts and events, whether they are currently active or have been closed, until the present date. This page offers both numerical data and graphical representations to help you analyze trends effectively. Here's what you can find on the Analytics page:
The Analytics page displays the count of alerts, along with the associated devices. This information covers all alerts, whether they are currently active or have been closed, up until the present date.
In the upper right corner, you'll find a box providing the count of different devices that have experienced alerts until the present date.
This graph provides a visual representation of the events, alerts, and conditions over different days versus their respective counts. You can sort this data by choosing from the dropdown menu provided for the graph. The available options include events, alerts, conditions, and an "all" category.
The timeline can be adjusted to view data up until the present date, or you can select specific time ranges, such as the last week, last month, or last 24 hours. The graph will display the count of events, alerts, and conditions until the present date.
This pie chart presents the count of all devices that have experienced events and alerts. The chart allows you to choose from a dropdown menu to view data up until the present date or select specific time ranges, such as the last week, last month, or last 24 hours.
The Top 10 Noisy Hosts section represents the devices with the highest number of events/alerts in both table and bar graph formats. This visual representation helps identify the devices that generate a significant number of alerts/events up until the present date.
Below the Noisy Hosts section, you will find the Suppression and Correlation table. This table provides a list of all the rules created up until the present date. You can filter the rules based on the specified time range, choosing from the dropdown options for the last week, last 24 hours, or last month.
The table also includes information such as the description of each rule and whether the rule is enabled or disabled.
Cost Analysis
If your business ecosystem depends on multicloud or hybrid cloud models, and need to manage multiple cloud accounts from various service providers. It becomes tedious to manually manage your billing and cost-related operations by logging into each account for cost management.
To ease out these monotonous tasks, UnityOne comes with pre-built cost management dashboards and helps you analyze, view, and optimize your cloud spending across all your multiple cloud accounts from a single pane. Most interestingly, you do not need to keep logging into your respective cloud accounts repeatedly; you only need to enroll your cloud account into UnityOne, and our portal assures the rest.
We support four public cloud deployments: AWS, Azure, Google Cloud, and Oracle. If you have a requirement to add other cloud service providers, we can add those integrations within UnityOne on-demand with applicable charges.
Navigation
Navigate toUnity Menu > Cost Analysis
Once you click on ‘Cost Analysis’ from the drop-down, you can navigate to cost analysis features of public cloud, data center, and cost calculator.
Public Cloud
You can view a detailed dashboard of your public cloud spending of resources from AWS, Azure, Google Cloud, and Oracle Cloud through the public cloud window.
On this page, you will find 4 different tabs: Summary, AWS, Azure, GCP, and Oracle, from where you can check the individual cost analysis of each public cloud provider with detailed graphical representation.
Summary
This tab will give you a consolidated view of all your public cloud spending from a central dashboard. It includes 4 different grids mentioned below:
First Grid:In this section, you will find month-to-date cost cloud spending of your Cloud Service Provider (CSP).Second Grid:In this section, you will find a widget from where you can find overall cloud spending of 12 months for all the Cloud Service Providers (CSPs).Third Grid:In this section, you will observe a real-time graph that displays cost breakdown by month for all Cloud Service Providers (CSPs).Fourth Grid:In this section, you can view a pie chart that displays average cost by each cloud.
In this tab, you will be able to view a detailed overview of the cloud spending of your AWS accounts. This dashboard will help you view and analyze your spending based on various cloud services of AWS in the form of a detailed graphical representation.
To view the cost analysis of your multiple AWS accounts, you will find a drop-down where you can select the preferred account to analyze the cost breakdowns.
First Grid:In this section, you can find information about all the services opted from the AWS cloud.Second Grid:In this section, you can find additional cost spending based on timestamps like month-to-date cost, previous month's cost, and estimated current cost.Third Grid:In this section, you can find the average monthly cost and the approx cost of trailing twelve-month.
Once you scroll below the grids, you will find the cost breakdowns of your AWS account in two levels:
- Service breakdown
- Region breakdown
Service breakdown
Users can view this service breakdown in two ways; one is graphical, the other in a tabular way (you can switch into these modes by clicking on icons just above the graph on the right-hand side).
Further, you can filter your service level breakdown by month or quarter from the available drop-down.
In the graphical view, you find months on the X-axis and on the Y-axis, the price range. You can hover over it to see the corresponding values. Also, you can view the color legends that indicate different cloud services availed from AWS.
In the tabular view, you can find services and their respective prices billed for different months in rows and columns.
Region Breakdown
This widget can break down your cloud costs based on the regions. To view these details, you can opt for a graphical view, or you can view in a simple tabular form as per your convenience (you can switch into these modes by clicking on icons just above the graph on the right-hand side).
Further, you can filter your regional level breakdown by month or quarter from the available drop-down.
In the graphical view, you find months on the X-axis and on the Y-axis, the price range. You can hover over it to see the corresponding values. Also, you can view the color legends that indicate different cloud services availed from AWS.
In the tabular view, you can find a region and respective prices billed for different months in the form of rows and columns.
In this module you will be able to view a detailed overview of the cloud spending of your Azure accounts. This dashboard will help you view and analyze your spending based on various cloud services of Azure in the form of a graphical representation.
To view the cost analysis of your multiple Azure accounts, you will find a drop-down where you can select the preferred account to analyze the cost breakdowns.
First Grid:In this section, you can find information about all the services opted from the Azure cloud.Second Grid:In this section, you can find additional cost spending based on timestamps like month-to-date cost, previous month's cost, and estimated current cost.Third Grid:In this section, you can find the average monthly cost and the approx cost of trailing twelve-month.
Once you scroll below the grids, you will find the cost breakdowns of your Azure account in two levels:
Service breakdownRegion breakdown
Service breakdown
Users can view this service breakdown in two ways; one is graphical, the other in a tabular way (you can switch into these modes by clicking on icons just above the graph on the right-hand side).
Further, you can filter your service level breakdown by month or quarter from the available drop-down.
In the graphical view, you find months on the X-axis and on the Y-axis, the price range. You can hover over it to see the corresponding values. Also, you can view the color legends that indicate different cloud services availed from Azure
In the tabular view, you can find services and their respective prices billed for different months in rows and columns.
Region Breakdown
This widget can break down your cloud costs based on the regions. To view these details, you can opt for a graphical view, or you can view in a simple tabular form as per your convenience (you can switch into these modes by clicking on icons just above the graph on the right-hand side).
Further, you can filter your regional level breakdown by month or quarter from the available drop-down.
In the graphical view, you find months on the X-axis and price range on Y-axis. You can hover over it to see the corresponding values. Also, you can view the color legends that indicate different cloud services availed from Azure.
In the tabular view, you can find a region and respective prices billed for different months in the form of rows and columns.
In this module, you will be able to view a detailed overview of the cloud spending of your GCP accounts. This dashboard will help you view and analyze your spending based on various cloud services of Google cloud in the form of graphs and tables.
To view the cost analysis of your multiple GCP accounts, you will find a drop-down where you can select the preferred account to analyze the cost breakdowns.
First Grid:In this section, you can find information about all the services opted from GCP.Second Grid:In this section, you can find additional cost spending based on timestamps like month-to-date cost, previous month's cost, and estimated current cost.Third Grid:In this section, you can find the average monthly cost and the approx cost of trailing twelve-month.
Once you scroll below the grids, you will find the cost breakdowns of your GCP account in two levels:
Service breakdownRegion breakdown
Service breakdown
Users can view this service breakdown in two ways; one is graphical, the other in a tabular way (you can switch into these modes by clicking on icons just above the graph on the right-hand side).
Further, you can filter your service level breakdown by month or quarter from the available drop-down.
In the graphical view, you find months on the X-axis and price range on Y-axis. You can hover over it to see the corresponding values. Also, you can view the color labels that indicate different cloud services availed from GCP.
In the tabular view, you can find services and their respective prices billed for different months.
Region Breakdown
This widget can break down your cloud costs based on the regions. To view these details, you can opt for a graphical view, or you can view in a simple tabular form as per your convenience (you can switch into these modes by clicking on icons just above the graph on the right-hand side).
Further, you can filter your regional level breakdown by month or quarter from the available drop-down.
In the graphical view, you find months on the X-axis and on the Y-axis, the price range. You can hover over it to see the corresponding values. Also, you can view the color legends that indicate different cloud services availed from GCP.
In the tabular view, you can find a region and respective prices billed for different months in the form of rows and columns.
In this module you can view a detailed overview of the cloud spending of your Oracle Cloud Infrastructure (OCI) accounts. This dashboard will help you view and analyze your spending based on various cloud services of OCI in the form of graphs and tables.
To view the cost analysis of your multiple Oracle Cloud accounts, you will find a drop-down where you can select the preferred account to analyze the cost breakdowns.
First Grid:In this section, you can find information about all the services opted from OCI.Second Grid:In this section, you can find additional cost spending based on timestamps like month-to-date cost, previous month's cost, and estimated current cost.Third Grid:In this section, you can find the average monthly cost, and the cost of trailing twelve-month.
Once you scroll below the grids, you will find the cost breakdowns of your OCI account in two levels:
Service breakdownRegion breakdown
Service breakdown
Users can view this service breakdown in two ways; one is graphical, the other in a tabular way (you can switch into these modes by clicking on icons just above the graph on the right-hand side).
Further, you can filter your service level breakdown by month or quarter from the available drop-down.
In the graphical view, you find months on the X-axis and on the Y-axis, the price range. You can hover over it to see the corresponding values. Also, you can view the color legends that indicate different cloud services availed from OCI.
In the tabular view, you can find services and their respective prices billed for different months in rows and columns.
Region Breakdown
This widget can break down your cloud costs based on the regions. To view these details, you can opt for a graphical view, or you can view in a simple tabular form as per your convenience (you can switch into these modes by clicking on icons just above the graph on the right-hand side).
Further, you can filter your regional level breakdown by month or quarter from the available drop-down.
In the graphical view, you find months on the X-axis and on the Y-axis, the price range. You can hover over it to see the corresponding values. Also, you can view the color legends that indicate different cloud services availed from OCI.
In the tabular view, you can find a region and respective prices billed for different months in the form of rows and columns.
Data Center
The data center section of UnityOne gives you an overview of the cost and billing details of your data centers that are present across various regions.
To navigate this section, click on Menu > Cost analysis > Data center.
Here you will find two different tabs on the top: a summary tab and a billing tab. Both tabs are clickable.
In the summary tab, you can view two different grids:
First Grid:In this grid, you can view the details of the number of data centers, cabinets, and PDUs billed for your infrastructure.Second Grid:In this grid, you can view the total billable amount of the current month and also you can find the amount of the current month’s cabinet and PDU costs.
Additionally, you can find the name of your data center, location, billed cost, and a couple of action buttons for each data center.
Action Buttons
Show bill details:You can use this action button to view detailed billing information for a particular data center.Manage by creating support tickets:From this action button you can manage your billing details by raising a ticket with the support team.
In this tab, you can select your data center location from the drop-down from where you can select your data center preferences based on your choice, you will get detailed billing information of that particular data center that includes data about the number of cabinets billed and the cabinet cost. Similarly, you can find the data for PDUs.
Also, you will find detailed billing information of cabinets and PDUs.
In the cabinet-level billing information, you can view the details like cabinet name, contract start date, contract end date, renewal, annual escalation rate, and current monthly cost
Action Button
Edit cabinet:You can use this button to edit your cabinet details.Manage by creating a support ticket:From this action button you can manage your cabinet billing details by raising a ticket with the support team.
In the PDU level billing information, you can view the PDU name, model, power circuit, cabinet, annual escalation rate, and current month’s cost.
Action Button
Edit PDU– You can use this action button to edit your PDU detailsManage by creating a support ticket:From this action button you can manage your PDU billing details by raising a ticket with the support team.
Cost calculator
The cost calculator section allows you to compare the cost of cloud services offered by multiple service vendors including G3 Private Cloud. The unique feature of UnityOne will give you a unified view of the cost involved without logging into your public cloud accounts. With the help of this cost calculator tool, you can plan your budget, and at the same time, you get a comparative view of costs quoted across various cloud providers.
- Start by selecting the cloud service providers you want to compare costs by clicking on the respective cloud tiles.
- You can drag the slider under vCPU to select the range of your vCPU.
- You can also drag the slider under RAM to determine the range of your RAM.
- Next, enter your storage requirement in the text box provided, followed by the number of instances.
- Now you have to choose the commitment/term from the drop-down and then click on search.
- You can see the results matching your search criteria for each cloud in separate boxes.
- Choose one instance from each cloud and click add to view a comparative table.
- After selecting your preferred choices, you can see the aggregated results in the table below.
- A comparative table with the cost and other selected requirements is displayed below.
- There is a reset button provided to reset your whole search activity .
Additionally, by clicking on ‘Export excel’, you can download these comparative details, or you can send the same to your email by clicking on send email button.
UnityReport
This is a self-service module from where you can generate reports of cloud inventory, data center inventory, utilization, analysis reports, etc. You can flexibly generate various reports of your choice on your infrastructure and also can schedule emails on a daily, weekly, and monthly basis of your inventory reports, or you can download them instantly as well.
Navigation
To navigate into the section, click on Menu > UnityOne report > Inventory
Inventory
From here you can generate and download two different inventory reports
Cloud Inventory
In this tab, you will be asked to fill following details to generate your inventory report:
- You need to select your cloud type from the drop-down (private, public, or all)
- Select your cloud from the other drop-down (Private Cloud – VMware, Hyper-V, open stack, etc. and Public cloud – AWS, GCP, Azure, OCI)
- Select your account/cloud name from the bottom drop-down
- Double check your selections, click on ‘Generate report.’
Once the inventory report is generated, you will find the in-depth details of your cloud resources for the account selected. These may include details such as hypervisors, bare-metal servers, virtual machines, containers, storage devices, switches, firewalls, etc. Along with the utilization charts for your RAM usage, vCPU, and storage.
- At the top right hand side of the page, you will find a button named ‘Save and schedule ’(the button will be disabled until the report is generated).
- To download or email the report instantly, click on the drop-down
- By selecting download or email you can instantly perform the preferred option.
- Click on the ‘Save and schedule’ button to schedule your reports
- Now you will be prompted to fill in details where you need to fill report name, select your schedule (daily, weekly, monthly ), and select a recipient (all users who were added to your UnityOne account will only appear under this), and under additional emails you can enter other emails to whom you want to share the reports.
- Also, you can opt for a detailed report by ticking the box ‘include r eport as an attachment.’
- Now click on ‘Submit’, and as per your preferences, an email will be scheduled accordingly.
Note If you get an error after clicking on submit, please ensure again that all the provided information is correct and if the issue still persists, contact the UnityOne support team.
Data center Inventory
In this tab, you will be asked to fill following details to generate your inventory report:
- At first, you need to select your data center from the drop-down.
- Then you have to select your cabinet from the second drop-down
- Next, you have to select your report type from the bottom drop-down (device/cabinet)
- Finally, double check your preferences , click on ‘Generate report.’
In this section, you will find latitude and longitude details of your data center location, number of cabinets, the status of the data center, and physical devices.
Next, you will find information about your cabinet in a tabular column, such as cabinet name, model, capacity available, occupied, alerts, temperature, power utilization, power capacity, and CO2 emission value.
Once you generate the report, you will see tiles that will give you insights about the number of hypervisors, bare metal servers, switches, firewalls, load balancers, Mac devices, storage, and other devices.
You will find insights into your various devices inside the selected data center location in a tabular column. You can also find details of the name of your device, its type, manufacturer, model, management IP, size, position, cabinet, and data center name.
- At the top right hand side of the page, you will find a button named ‘Save and schedule ’(the button will be disabled until the report is generated).
- To download or email the report instantly, click on the accordion.
- By selecting download or email you can instantly perform the preferred option.
- Click on the ‘Save and schedule’ button to schedule your reports
- Now you will be prompted to fill in details where you need to fill report name, select your schedule (daily, weekly, monthly), and select a recipient (all users who were added to your UnityOne account will only appear under this), and under additional emails, you can enter other emails to whom you want to share the reports.
- Also, you can opt for a detailed report by ticking the box ‘include report as an attachment.’
- Now click on ‘Submit’, and as per your preferences, an email will be scheduled accordingly.
Note If you get an error after clicking submit, please ensure again that all the provided information is correct and if the issue still persists, contact the UnityOne support team.
Reports
This page will give you a consolidated view of your reports' schedule history, including the report's name, scheduled generation time, active status, and timestamp of created and updated.
Action Buttons:
View Reports– This action button will help you to view the generated reports.Edit– This action button will help you edit your preferences of the scheduled report.Delete– From this action button, you can permanently delete the scheduled report.Disable/Enable– This action button will help you enable or disable the scheduling.Manage by creating a support ticket– From this action button you can manage your reports by raising a ticket with the support team.
Support
With the UnityOne support service, you can use ServiceNow, dynamics CRM ticket management, or any service management system of your choice (you can raise a request for integration of a service management tool into UnityOne) to create, maintain and manage your support tickets.
Additionally, you can draw valuable insights into your daily operation with inbuilt support analytics.
Currently, Unity is equipped with ServiceNow ITSM and Microsoft Dynamics CRM.
- To add your ITSM to UnityOne, navigate to Menu > UnitySetup > Integration
- From the integration page, click on the ‘Connect Now’ button that is available beside the ServiceNow logo.
- From the top of the page, click on ‘Add account’
- Next, add the name of your ITSM, instance URL, username, and password
- Finally, click on ‘Submit’ and your ServiceNow account will be added to UnityOne.
Note If you get an error after clicking submit, please ensure again that all the provided information is correct and if the issue still persists, contact the UnityOne support team.
- To add your Microsoft Dynamics CRM to UnityOne, navigate to Menu > UnitySetup > Integration
- From the integration page, click on the ‘Connect Now’ button that is available beside the ServiceNow logo.
- From the top of the page, click on ‘Add account’
- Next, add the name of your Microsoft Dynamics CRM, CRM URL, Client ID, Tenant ID, Account ID, Access type from the drop-down , Username, and Password
- Finally, click on ‘Submit’ and your account will be added to UnityOne.
Note If you get an error after clicking submit, please ensure again that all the provided information is correct and if the issue still persists, contact the UnityOne support team.
Navigation
To navigate the support section of UnityOne, click on Menu > Support > Ticket Management
This page will give details on your organizational ticket management in graphs and tables, from which you can derive insights on status, priority, response time, etc.
The top grid will display tabs with the names of your service integration platform. Click on the desired tabs to view and manage the tickets.
Once you click on the preferred service account tab, you can see different graphs and tabular columns with ticket details. Here, you will find other tabs for various ticket types: All tickets, change tickets, incident tickets, problem tickets, and request tickets.
This tab contains all your ITSM tickets from where you can monitor and manage organizational tickets via a common dashboard. The top grid will give you insights on tickets by priority, tickets by status, and solve by response type.
If you have integrated both Dynamics CRM and Service No
The second grid allows you to apply filters to search ticket history. The filters include:
Search–Using this filter, you can search for tickets via a keyword.Status– This filter will be helpful to search tickets based on status (Active/Resolved/Cancelled/All).Date Created– You can use this filter to search tickets based on the start and end date of your choice.Priority– This filter will help you search tickets based on priority (Critical/High/Normal/Low/All).Type– This filter will help you search tickets based on type (Change/Incident/Problem/Question/Request).
Finally, click on ‘Filter’ to view your results.
By default, in the form of tabular column you will be able to find details of your latest tickets that includes information on ticket number, type, title, status, status reason, priority, created on, and updated on.
If you have applied filters, you will find the details of your tickets in the form of the same tabular column with the similar information.
Note 1 You can increase or decrease the show of tickets in the tabular column from the accordion besides the field ‘show’ (available options: 10 or 25).
Note 2 You can download the details of tickets in the form of .csv file by clicking on the ‘Download’ button.
Note 3 You can also raise a new ticket by clicking on the ‘Create ticket’ button.
Note 4 You can also refresh the dashboard by clicking on the ‘Refresh’ button placed on the top right corner of the second grid.
This tab will contain the details of all your tickets raised for change request . The top grid will give you insights on tickets by priority, tickets by status, and solve by response type.
The second grid allows you to apply filters to search ticket history. The filters include:
Search– Using this filter, you can search for tickets via a keyword.Status– This filter will be helpful to search tickets based on status (Active/Resolved/Cancelled/All).Date Created– You can use this filter to search tickets based on the start and end date of your choice.Priority– This filter will help you search tickets based on priority (Critical/High/Normal/Low/All).Type– This filter will help you search tickets based on type (Change/Incident/Problem/Question/Request).
Finally, click on ‘Filter’ to view your results.
By default, in the form of tabular column you will be able to find details of your latest tickets that includes information on ticket number, type, title, status, status reason, priority, created on, and updated on.
If you have applied filters, you will find the details of your tickets in the form of the same tabular column with the similar information.
Note 1 You can increase or decrease the show of tickets in the tabular column from the accordion besides the field ‘show’ (available options: 10 or 25).
Note 2 You can download the details of tickets in the form of .csv file by clicking on the ‘Download’ button.
Note 3 You can also raise a new ticket by clicking on the ‘Create ticket’ button.
Note 4 You can also refresh the dashboard by clicking on the ‘Refresh’ button placed on the top right corner of the second grid.
This tab will contain the details of all your tickets raised for support on incidents. The top grid will give you insights on tickets by priority, tickets by status, and solve by response type.
The second grid allows you to apply filters to search ticket history. The filters include:
Search– Using this filter, you can search for tickets via a keyword.Status– This filter will be helpful to search tickets based on status (Active/Resolved/Cancelled/All).Date Created– You can use this filter to search tickets based on the start and end date of your choice.Priority– This filter will help you search tickets based on priority (Critical/High/Normal/Low/All).Type– This filter will help you search tickets based on type (Change/Incident/Problem/Question/Request).
Finally, click on ‘Filter’ to view your results.
By default, in the form of tabular column you will be able to find details of your latest tickets that includes information on ticket number, type, title, status, status reason, priority, created on, and updated on.
If you have applied filters, you will find the details of your tickets in the form of the same tabular column with the similar information.
Note 1 You can increase or decrease the show of tickets in the tabular column from the accordion besides the field ‘show’ (available options: 10 or 25).
Note 2 You can download the details of tickets in the form of .csv file by clicking on the ‘Download’ button.
Note 3 You can also raise a new ticket by clicking on the ‘Create ticket’ button.
Note 4 You can also refresh the dashboard by clicking on the ‘Refresh’ button placed on the top right corner of the second grid.
This tab will contain the details of all your tickets raised for platform support. The top grid will give you insights on tickets by priority, tickets by status, and solve by response type.
The second grid allows you to apply filters to search ticket history. The filters include:
Search– Using this filter, you can search for tickets via a keyword.Status– This filter will be helpful to search tickets based on status (Active/Resolved/Cancelled/All).Date Created– You can use this filter to search tickets based on the start and end date of your choice.Priority– This filter will help you search tickets based on priority (Critical/High/Normal/Low/All).Type– This filter will help you search tickets based on type (Change/Incident/Problem/Question/Request).
Finally, click on ‘Filter’ to view your results.
By default, in the form of tabular column you will be able to find details of your latest tickets that includes information on ticket number, type, title, status, status reason, priority, created on, and updated on.
If you have applied filters, you will find the details of your tickets in the form of the same tabular column with the similar information.
Note 1 You can increase or decrease the show of tickets in the tabular column from the accordion besides the field ‘show’ (available options: 10 or 25).
Note 2 You can download the details of tickets in the form of .csv file by clicking on the ‘Download’ button.
Note 3 You can also raise a new ticket by clicking on the ‘Create ticket’ button.
Note 4 You can also refresh the dashboard by clicking on the ‘Refresh’ button placed on the top right corner of the second grid.
This tab will contain the details of all your tickets raised for support on service related query. The top grid will give you insights on tickets by priority, tickets by status, and solve by response type.
The second grid allows you to apply filters to search ticket history. The filters include:
Search– Using this filter, you can search for tickets via a keyword.Status– This filter will be helpful to search tickets based on status (Active/Resolved/Cancelled/All).Date Created– You can use this filter to search tickets based on the start and end date of your choice.Priority– This filter will help you search tickets based on priority (Critical/High/Normal/Low/All).Type– This filter will help you search tickets based on type (Change/Incident/Problem/Question/Request).
Finally, click on ‘Filter’ to view your results.
By default, in the form of tabular column you will be able to find details of your latest tickets that includes information on ticket number, type, title, status, status reason, priority, created on, and updated on.
If you have applied filters, you will find the details of your tickets in the form of the same tabular column with the similar information.
Note 1 You can increase or decrease the show of tickets in the tabular column from the accordion besides the field ‘show’ (available options: 10 or 25).
Note 2 You can download the details of tickets in the form of .csv file by clicking on the ‘Download’ button.
Note 3 You can also raise a new ticket by clicking on the ‘Create ticket’ button.
Note 4 You can also refresh the dashboard by clicking on the ‘Refresh’ button placed on the top right corner of the second grid.
This tab will contain the details of all your tickets raised for support on service requests. The top grid will give you insights on tickets by priority, tickets by status, and solve by response type.
The second grid allows you to apply filters to search ticket history. The filters include:
Search– Using this filter, you can search for tickets via a keyword.Status– This filter will be helpful to search tickets based on status (Active/Resolved/Cancelled/All).Date Created– You can use this filter to search tickets based on the start and end date of your choice.Priority– This filter will help you search tickets based on priority (Critical/High/Normal/Low/All).Type– This filter will help you search tickets based on type (Change/Incident/Problem/Question/Request).
Finally, click on ‘Filter’ to view your results.
By default, in the form of tabular column you will be able to find details of your latest tickets that includes information on ticket number, type, title, status, status reason, priority, created on, and updated on.
If you have applied filters, you will find the details of your tickets in the form of the same tabular column with the similar information.
Note 1 You can increase or decrease the show of tickets in the tabular column from the accordion besides the field ‘show’ (available options: 10 or 25).
Note 2 You can download the details of tickets in the form of .csv file by clicking on the ‘Download’ button.
Note 3 You can also raise a new ticket by clicking on the ‘Create ticket’ button.
Note 4 You can also refresh the dashboard by clicking on the ‘Refresh’ button placed on the top right corner of the second grid.
Unity Feedback
This section will give the history of tickets raised by you to share the feedback on UnityOne.
You can graphically view insights on Unity feedback tickets based on tickets by priority, tickets by status, and by solved response time. You can also use the below filters to view tickets as per your preference.
Filters:
Search:– In this field you have to enter a keyword to search your particular ticket.Status:– In this field you have to select the status from the drop-down (Active/Resolved/Cancelled).Date Created:– In this field, you can select your preferred duration.Priority:– In this field you have to select your priority type from the drop-down.
After selecting the required filters, click on the button ‘Filter’ to get your results. You can also download the results in the form of excel sheet by clicking on the ‘Download’ button.
Maintenance
This section is helpful for you to add your maintenance calendar to UnityOne or view your maintenance history so that team members can be aware of upcoming, ongoing, or past maintenance activities.
- From the top, click on ‘Add’, and a new window will pop-up.
- From the window, select your data center from the drop-down
- Then, select the status of your maintenance (Ongoing/Future Plan/Completed)
- Now, you have to give a short description of your maintenance schedule.
- You have to enter a start date and an end date (please note that dates are selected in–8:00 PST).
- Now, you have to select the already added users from the notification drop-down to send them an email.
- If you need to add any other additional email that is not registered to the UnityOne account, you can mention them in the additional email box.
- Finally, click on ‘Submit’ to successfully add your maintenance schedule to UnityOne
NoteIf you get an error after clicking submit, please ensure again that all the provided information is correct and if the issue still persists, contact the UnityOne support team.
Additionally, you can view the history of the previously scheduled maintenance which includes details such as description, status, data center name, start date, and end date of maintenance schedules.
Action Buttons:
Edit: This action button will help you to edit your scheduled maintenance details.Delete: This action button will help you to delete your scheduled maintenance entries.
Documentation
The documentation section will give you details on the user guide, release notes, current releases and previous UnityOne releases.
Report an Issue
This section will help you in reporting an issue with UnityOne support team.
To navigate this section, click on Menu > UnityOneSetup > Report an issue
Once you click on the button ‘Report an issue’ from the menu. Once you click on the button, a new pop-up will open. Enter the following details within the pop-up:
Subject: In this field, you will get a default subject line which can also be edited.CC: In this field you, you can add the email IDs of any additional users that you wish to notify.Priority: In this field you have to select the level of priority (critical/high/normal/low).Description: In this field you have to write a description of your issue.Meta Data: This comes pre-filled set of data which is not editable.Attachments: In this field you can choose any files to attach to further support your issue.
Click on ‘Send’ to successfully deliver your report of the issue to UnityOne support team.
NoteAlternatively, you can also report your issue directly via email by clicking on the button ‘Click here to report via email’ which is present at the bottom left of the pop-up.
UnitySetup
This module will assist you to onboard your assets into UnityOne. We offer various onboarding methods to simplify your onboarding steps.
NoteThe ‘User groups’ and ‘Onboarding’ sections of this module are already discussed under the prerequisites module at the beginning of the UnityOne guide; please refer to that section for the detailed steps.
Import LDAP user
This feature will enable your organization to integrate your active directory service to import its users within the organization.
To navigate this section, click on Menu > UnityOneSetup > Import LDAP
From the top right-hand side of this page, click on ‘Add’ button and a new pop-up will open. Fill in the required details such as:
LDAP URL: Enter the URL address of your LDAP account.Username: Enter the username of your LDAP account.Password: Enter the password of your LDAP accountDomain name: Enter your organizational domain name.
Finally, click on ‘Submit’ to import your user details into UnityOne
NoteIf you get an error after clicking submit, please ensure again that all the provided information is correct and if the issue still persists, contact the UnityOne support team.
On this page, you will find the details of your added LDAP accounts which includes details of the LDAP URL, Username, and Domain name.
Once you add an LDAP account, it will register the users of your existing active directory and by performing the ‘Import user’ action you can authenticate the user access of UnityOne for the preferred user. You can change the access of the user from admin to the user or vice versa from the user group section.
Action Buttons:
Edit LDAP Configuration: This action button will help you to edit the added LDAP configuration details.Import User: This action button will help you can import a LDAP user to UnityOne.Delete LDAP Configuration: This action button will help you to delete your added LDAP configuration.Manage by creating a support ticket: From this action button you can manage your LDAP configuration details by raising a ticket with the support team.
Integration
In the integrations, you can find different third-party integration platforms like ServiceNow and Microsoft Dynamics CRM. You can also raise a request for integrations of ITSM services to the UnityOne platform.
To navigate this section, click on Menu > UnitySetup > Integration
Currently, we support the direct integration of ServiceNow ITSM and Microsoft Dynamics CRM
- To add your ITSM to UnityOne, navigate to Menu > UnitySetup > Integration
- From the integration page, click on the ‘Connect Now’ button that is available beside the ServiceNow logo.
- From the top of the page, click on ‘Add account’
- Next, add the name of your ITSM, instance URL, username, and password
- Finally, click on ‘Submit’ and your account will be added to UnityOne.
NoteIf you get an error after clicking submit, please ensure again that all the provided information is correct and if the issue still persists, contact the UnityOne support team.
- To add your Microsoft Dynamics CRM to UnityOne, navigate to Menu > UnitySetup > Integration
- From the integration page, click on the ‘Connect Now’ button that is available beside the ServiceNow logo.
- From the top of the page, click on ‘Add account’
- Next, add the name of your Microsoft Dynamics CRM, CRM URL, Client ID, Tenant ID, Account ID, Access type from the accordion, Username, and Password
- Finally, click on ‘Submit’ and your account will be added to UnityOne.
NoteIf you get an error after clicking submit, please ensure again that all the provided information is correct and if the issue still persists, contact the UnityOne support team.
Notifications Setup
You can use this section to manage your notification settings or you can also add new group notifications based on alert types.
To navigate this section, click on Menu > UnityOneSetup > Notification Setup
To create a new group notification, click on the button ‘Create Group’ from the top of the page. Once you click on the button, a new pop-up will open. Enter the following details within the pop-up:
Group Name: In this field you have to name a new group.Users: In this field you have to type the email ID of your new users.Alert Type: In this field, you have to select the alert type from the drop-down. (Critical/Info/Warning).Mode: This will come with a default email mode.
Click on ‘Submit’ to create a new group notification alert.
NoteIf you get an error after clicking submit, please ensure again that all the provided information is correct and if the issue still persists, contact the UnityOne support team.
On the page, you can find the details of existing notification groups such as: Group name, users, alert type, mode, and its status.
Action Buttons:
Enable/Disable: From this action you can enable or disable the group notification alert of the particular group name.Edit: This action button will help you in editing the details of notification group.Delete: This action button will assist you to delete the notification group.
NoteYou can disable all enabled notifications by clicking on the button ‘Disable all notification’ which is present on the top-right hand side corner.